Comparative Study
. 2010 Dec;13(12):1463-71.
doi: 10.1038/nn.2665. Epub 2010 Oct 31.

Kinesin 3 and cytoplasmic dynein mediate interkinetic nuclear migration in neural stem cells

Affiliations
Comparative Study

Kinesin 3 and cytoplasmic dynein mediate interkinetic nuclear migration in neural stem cells

Jin-Wu Tsai et al. Nat Neurosci. 2010 Dec.

Abstract

Radial glial progenitor cells exhibit bidirectional cell cycle-dependent nuclear oscillations. The purpose and underlying mechanism of this unusual 'interkinetic nuclear migration' are poorly understood. We investigated the basis for this behavior by live imaging of nuclei, centrosomes and microtubules in embryonic rat brain slices, coupled with the use of RNA interference (RNAi) and the myosin inhibitor blebbistatin. We found that nuclei migrated independent of centrosomes and unidirectionally away from or toward the ventricular surface along microtubules, which were uniformly oriented from the ventricular surface to the pial surface of the brain. RNAi directed against cytoplasmic dynein specifically inhibited nuclear movement toward the apical surface. An RNAi screen of kinesin genes identified Kif1a, a member of the kinesin-3 family, as the motor for basally directed nuclear movement. These observations provide direct evidence that kinesins are involved in nuclear migration and neurogenesis and suggest that a cell cycle-dependent switch between distinct microtubule motors drives interkinetic nuclear migration.


Figures
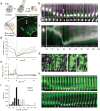
Figure 1
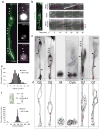
Figure 1. Nuclear and centrosomal dynamics in radial glial progenitor cells throughout cell cycle
(a) Schematic diagram of transfection using intraventricular injection follow by in utero electroporation. Radial glial progenitors expressing GFP were observed to expand throughout the entire thickness of the neocortex (arrowheads). Bar = 50 μm. (b) Live imaging of radial glial progenitors expressing GFP (green) and CFP-histone H1 (magenta; H1 expression is shown for cell body region in black and white at bottom) in live E18 rat brain slice. During a 4 hr period the radial glial progenitor cell body can be seen to move apically toward the ventricular surface (dashed line), where the cell went through mitosis, during which the basal process (arrowheads) persisted, though thinner (panel 5:40), and the progeny cells moved basally (Movie S1). Time = hh:mm. (c) Kymograph of the same cell imaged using histone H1 for 18 hr showing marked changes in nuclear migration rate in the apical direction, and prolonged, more uniform movement in the basal direction following mitosis. Bars = 5 μm. (d) Tracings of nuclear movements of the radial glial progenitor cell shown in panel A and B (blue tracing) and two other cells (green and magenta tracings). Each cell generated two progeny nuclei which moved basally at comparable rates. (e) Velocities of nuclear movements in (d). Bursts of fast movements up to 1 μm/min could be seen as the nucleus during apically directed (-5 hr to 0 hr) but not during basally directed movement (1hr - 10 hr). The tracings are aligned for a common mitotic start time (grey area). (f) Histograms of the velocity during apically- and basally- directed movements. The velocity distribution of the apical nuclear movements is spread out higher speed movements, whereas the distribution of basal movements is very narrow. (g) Fixed E18 rat brain section two days after in utero electroporation with cDNAs encoding GFP (green) and DsRed-centrin II (magenta). GFP-positive cells expressing DsRed-centrin II-labeled centrosomes can be found within the VZ (box 1) and SVZ (box 2) with centrosomes located throughout both regions, and at the ventricular surface in the endfeet of radial glial progenitor cells. Bar = 10 μm. Bar in insert = 5 μm. (h) Live imaging of a radial glial cell expressing GFP (green) and RFP-centrin II (magenta). Top panels: During downward (apical) nuclear movement, the centrosome remains at the ventricular surface. At the onset of mitosis (0:40) one centrosome (white arrows) departs from the ventricular surface and, following cytokinesis (2;00), returns to this site (3:00). The other centrosome stays close to the ventricular surface throughout mitosis (black arrows). The cell bodies of the daughter cells then migrate upward in a comparably slow and continuous manner (Movie S2). Bottom panels: In some cases, one of the centrosomes departs from the ventricular surface (white arrows) while the other returns to the ventricular surface (Movie S4), as observed in asymmetric cell divisions .
Figure 2
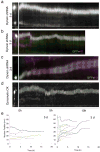
Figure 2. Microtubule organization in radial glial progenitors throughout the cell cycle
(a) Microtubules of radial glial progenitors expressing GFP-Tubulin (green) in E18 rat brain slices. Left panel: Tubulin is distributed throughout interphase cells, with bundles of microtubules parallel to the long axis of the cell seen in favorable, dilated cell regions (arrows). Right panels: Dividing cell showing mitotic spindle. Basal process remains visible during division (top, arrows), as detected using soluble RFP, whereas tubulin-GFP cannot be found in this region (bottom). (b) Time-lapse images of plus-ends of growing microtubules labeled with GFP-EB3 (green) in an interphase radial glial progenitor cell at E18. (Centrosome is indicated in magenta (arrowhead) by DsRed-centrin co-expression.) Fluorescence images were taken every second. Time series of EB3 images in three regions correspondent to the basal process (box 1), soma (box 2) and apical process (box 3) are aligned to form a kymograph. “Comet tail”-like EB3 streaks are readily observed to move predominantly in the basal direction (arrowheads). (c), (d) GFP-EB3 behavior and microtubules organization in radial glial cells at different cell-cycle stages. (c) Superimposed negative contrast images of EB3 streaks (arrowheads) and centrosomes (double arrowheads, red) from 30 sec - 2 min time-lapse movies. (d) Tracings of the EB3 streaks using multiple colors to distinguish among individual microtubules. When soma is in the upper portion of the VZ (G2), EB3 streaks are mostly found to originate from the centrosomal region within the endfeet, curve around the nucleus, and enter the basal process (arrows; Movie S5, S6). During mitosis (M), EB3 streaks radiate from the two spindle poles to form the mitotic spindle. No detectable EB3 streaks enter the basal process (Movie S7). During cytokinesis (Cyto), the microtubules still radiate from the centrosomes in each daughter cell, with many microtubules aimed toward the midbody. EB3 streaks remain absent from the basal processes at this stage (Movie S8). (Non-radial glial cells are seen in uppar portion of image.) Paired cells following probable symmetric RGPC division (Symm) as evidenced by persistence of centrosomes at the endfeet of both daughter cells (Movie S9). EB3-tipped microtubules are oriented upward in both cells and now re-enter the basal fibers (arrows). Paired cells following probable asymmetric (Asym) RGPC division. The centrosome of daughter cell at right is shifted away with EB3 streaks emerging radially to now form a bidirectional microtubule array (Movie S10). Bars = 5 μm. (e) Velocity distribution shows EB3 movements to be comparable to migrating neurons and other cells. KIF1 A RNAi does not significantly affect the rate of EB3 movements in these cells. (f) Direction distribution of the EB3 movements during interphase indicates that 93% are oriented toward the basal directions. KIF1A RNAi has no obvious effects on the overall orientation of EB3 movements.
Figure 3
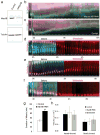
Figure 3. Effects of dynein functional inhibition on interkinetic nuclear migration in radial glial progenitors
(a) A radial glial progenitor cell in E21 rat brain slice imaged 5 days after in utero electroporation with cDNA construct expressing cytoplasmic dynein HC shRNA and GFP. The cell exhibited normal bipolar morphology (shown at left), but with nuclear motility limited to a gradual drifting toward the ventricular surface (Movie S11). (b) Radial glial cell expressing dynein HC shRNA construct plus CFP-histone-H1 (magenta) at E19, 3 days following in utero electroporation. The nucleus migrated toward the ventricular surface. but with shorter and more intermittent movements, at a slower than normal average rate (see text for details; Movie S13). (c) Normal basally directed nuclear movement of paired radial glial cell nuclei at E19, following 3 days of HC RNAi (conditions as in panel B; Movie S14). (d) Severe inhibition of INM in cells overexpressing dynamytin for 1.5 days (Movie 12). (e) Tracings of the nucleus in cells expressing dynein shRNA for 5 days (left panel) and 3 days (right panel). Most of the nuclei were immobile after 5 days of dynein RNAi, so neither apically- or basally directed movement is observed. However, in cells expressing dynein HC shRNA for 3 days, the apically directed movements were largely inhibited (dashed lines), whereas the basally directed movements were comparable to controls (Table S1). Bar = 5 μm
Figure 4
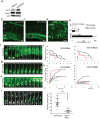
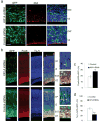
Figure 4. Myosin 2B is not essential for interkinetic nuclear migration
(a) Western blot showing a substantial 65-70% decrease in myosin IIB expression in Rat2 cells transfected with myosin IIB shRNA for 3 days. (b)-(e) E18 rat brain slices monitored by live time-lapse imaging following myosin II RNAi or exposure to the myosin II inhibitor blebbistatin. Nuclei were imaged using CFP-histone-H1 and either GFP for RNAi or DsRed for use with blebbistatin. GFP (green) and CFP-histone-H1 (magenta) were co-expressed with and without myosin IIB shRNA (Movies S15, S16). No apparent effect on basally directed movement of radial glial nucleus is observed relative to control (b, c). Cells co-transfected with DsRed (red) and CFP-histone-H1 (blue) were treated with 50 μm blebbistatin for 3-5 hrs during live cell imaging. No effect was observed on apically directed (d) or basally directed (e) nuclear movement in radial glial cells. However, cell in (f) was blocked in mitosis as expected. (White dashed lines indicate ventricular surface; see Movies S17-S19). Bar = 5 μm. (g) Duration of mitosis increases about 2-fold in cells subjected to myosin IIB RNAi. **: p<0.01. (H) Velocities of apically and basally directed movements in cells treated with myosin IIB shRNA and blebbistatin showing no significant difference between these groups and the control.
Figure 5
Figure 5. KIF1A is required for basally directed nuclear movement
(a) KIF1A RNAi reduced KIFA levels by 70% as judged by immunoblotting of PC12 cells exposed to shRNA construct for 2 days. (b-d) E16 rat embryonic brains were electroporated with scrambled (b) or KIF1A shRNAs (c, d), fixed, and then imaged at E20. Inset from panel c is shown at higher power in d. KIF1A RNAi caused clear and potent inhibition of cell redistribution relative to control, with almost complete loss of cells from intermediate zone (IZ) and cortical plate (CP), and accumulation of radial glial cell somata near ventricular surface. Persistence of radial glial basal process staining in IZ indicates retention of overall cell morphology. Scale bar=50μm. (e) Quantification of cell distribution in scrambled (blue bar) vs. KIF1A (red bar) shRNA-expressing brain slices showing significant decreases in neural cell redistribution (p<0.001; student's t-test, compare with scrambled). (f-h) Apically directed nuclear movement was recorded by time-lapse imaging of radial glial cells expressing scrambled shRNA (F; Movie S20), and KIF1A shRNA (g, h). Basally directed nuclear movement was inhibited in both (g) or one (h) of the daughter cells. (i) The cnetrosome of the mobile daughter moved away from ventricular surface, a behavior consistent with newborn neurons (Fig. 1h) . (Dashed lines indicate ventricular surface; time = hh:mm; Movie S21, S22). Bar = 5 μm. (j) Tracings of nuclear migration show no apparent effect of KIF1A RNAi in apical direction. (k) In contrast, marked effects are observed in basal direction for all by one nucleus (blue line), which exhibits rapid movement characteristic of newly-formed neuron. Note potent inhibition of nuclear migration in sibling of this cell (also in blue). (l) Final nuclear position following recording of basally directed nuclear movements. Average nuclear positions were is 34.096 ± 11.6 vs. 9.6 ± 6.5 μm for control and KIF1A RNAi conditions, respectively. (0 of Y-axis indicates ventricular surface; p<0.001; student's t-test, n = 22).
Figure 6
Figure 6. Effects of KIF1 RNAi on cell cycle progression and cell fate determination
(a) Brain sections stained with phosphovimentin (4A4) antibody (Red) 4 days after electroporation showing mitotic cells. Bar = 50 μm. (b) Brain sections stained with progenitor marker Pax6 (Red) and neuronal marker TuJ1 (Blue). The right panels shows examples of TuJ1 (arrows) and Pax6 (arrowheads) positive cells in the boxed areas. Bar = 100 μm. (c) Quantification of mitotic index of the transfected GFP+ cells within the VZ. There is no significant difference between cells electroporated with KIF1A and control shRNA. (d) Duration of mitosis in radial glial progenitors in live brain slices showing no obvious effects of KIF1A shRNA on mitosis. (e), (f) Quantifications of the percentage of Pax6+ or TuJ1+ cells, respectively, among the transfected GFP+ cells in brain sections. *: p<0.05; **: p<0.01, student's t-test.
Figure 7
Figure 7. Rescue of KIF1A RNAi, and model for bidirectional nuclear migration
(a-c) E16 rat brain transfected by in utero electroporation with KIF1A shRNA (green) tested for rescue by co-expression of DsRed (red); DsRed-human KIF1A (red), and myc-human KIF1A, and fixed at E20. Clear rescue of neuronal misdistribution phenotype is produced by co-expression of DsRed-human KIF1A (red) or (c) myc-human KIF1A, but not by DsRed alone. Bar=50μm. (d) Statistical analysis of rescue experiments reveals recovery of cell number within the three brain regions shown (see Table S3 for details). For rescue by myc-huKIF1A all GFP-positive cells were counted, whereas on the DsRed-huKIF1A-expressing GFP-positive cells (87% of total) were counted. Significant rescue was observed with DsRed-human KIF1A (grey bar, p<0.001 compare with DsRed; student's t-test) and Myc-humanKIF1A (white bar, P<0.001 compare with DsRed, student's t-test). (e) Live recording of basally directed nuclear movement in KIF1A RNAi cells (green) co-expressing DsRed (red, also see Movie S23), or recued by co-expression of DsRed-human KIF1A (red, also see Movie S24). Bar = 5 μm (f) Tracings of basally directed nuclar movement in control and DsRed-human KIF1A rescued cells. Each color represents progeny of one radial glial progenitor cell division. (g) Final nuclear position following recording of basally directed nuclear movements Nuclear localization from apical directed nuclear movement were plotted. Average nuclear position is 34.22±3.31 vs. 9.49±2.61 μm for DsRed-huKIF1A and DsRed rescues of KIF1A RNAi, respectively. (0 μm in Y-axis indicates ventricular surface p<0.001; student's t-test, n = 11).

Comment in

Similar articles

Cited by

References

    1. Solecki DJ, Model L, Gaetz J, Kapoor TM, Hatten ME. Par6alpha signaling controls glial-guided neuronal migration. Nat Neurosci. 2004;7:1195–1203. - PubMed
    1. Bellion A, Baudoin JP, Alvarez C, Bornens M, Metin C. Nucleokinesis in tangentially migrating neurons comprises two alternating phases: forward migration of the Golgi/centrosome associated with centrosome splitting and myosin contraction at the rear. J Neurosci. 2005;25:5691–5699. - PMC - PubMed
    1. Schaar BT, McConnell SK. Cytoskeletal coordination during neuronal migration. Proc Natl Acad Sci U S A. 2005;102:13652–13657. - PMC - PubMed
    1. Tsai JW, Bremner KH, Vallee RB. Dual subcellular roles for LIS1 and dynein in radial neuronal migration in live brain tissue. Nat Neurosci. 2007;10:970–979. - PubMed
    1. Tsai JW, Chen Y, Kriegstein AR, Vallee RB. LIS1 RNA interference blocks neural stem cell division, morphogenesis, and motility at multiple stages. J Cell Biol. 2005;170:935–945. - PMC - PubMed

Publication types