Comparative Study
. 2010 Dec;13(12):1549-53.
doi: 10.1038/nn.2663. Epub 2010 Oct 31.

Microsaccades precisely relocate gaze in a high visual acuity task

Affiliations
Comparative Study

Microsaccades precisely relocate gaze in a high visual acuity task

Hee-Kyoung Ko et al. Nat Neurosci. 2010 Dec.

Abstract

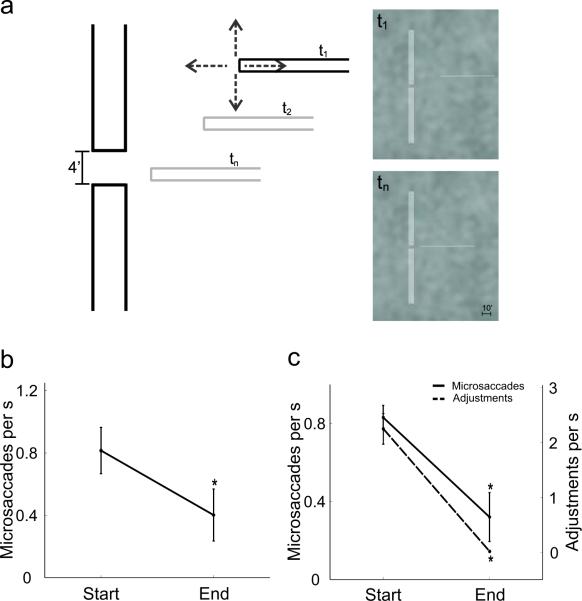
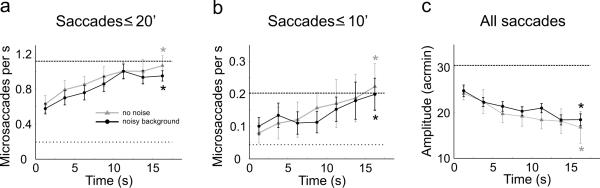
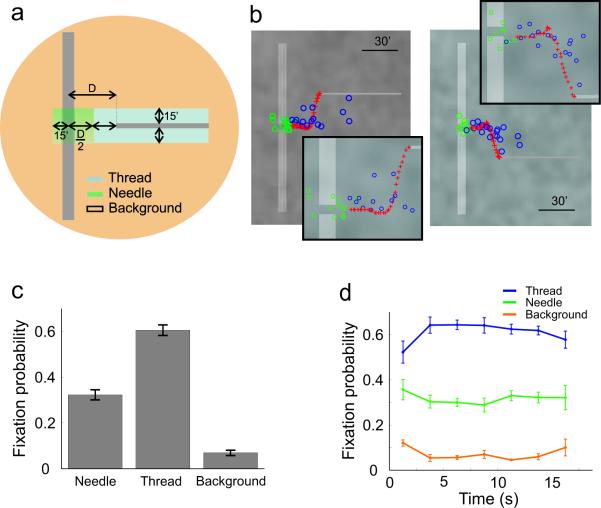
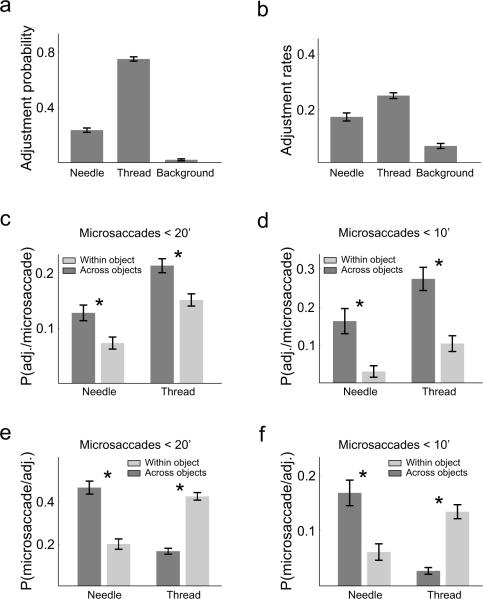
The image on the retina is never stationary. Microscopic relocations of gaze, known as microsaccades, occur even during steady fixation. It has long been thought that microsaccades enable exploration of small regions in the scene in the same way saccades are normally used to scan larger regions. This hypothesis, however, has remained controversial, as it is believed that microsaccades are suppressed during fine spatial judgments. We examined the eye movements of human observers in a high-acuity visuomotor task, the threading of a needle in a computer-simulated virtual environment. Using a method for gaze-contingent display that enables accurate localization of the line of sight, we found that microsaccades precisely move the eye to nearby regions of interest and are dynamically modulated by the ongoing demands of the task. These results indicate that microsaccades are part of the oculomotor strategy by which the visual system acquires fine spatial detail.


Figures

Figure 1
Figure 1
Threading a virtual needle. (a) The arena in which all the threading experiments of this study were conducted. Subjects used a joypad to align a horizontal bar (the thread) with the gap in a vertical bar (the needle). The gray bars represent the positions of the thread at various times during the course of the trial. The actual stimulus on the display is shown in the right panels for two different times, t1 and tn. (Bottom Row) Results from two experiments with conditions similar to those of previous studies: (b) Bridgeman and Palca (1980), and (c) Winterson and Collewijn (1976). The two intervals refer to the initial 4 s (Start) and the last 0.5 s (End) in each trial. In (c), both the mean microsaccade rate and the frequency of adjustments in the thread's vertical position are shown. Significant differences between the initial and final periods are marked by * (p < 0.01; one-tailed t-test). In this and all the following figures, error-bars represent s.e.m..
Figure 2
Figure 2
Comparison of saccade characteristics in three different tasks: threading, sustained fixation on a marker, and free viewing of natural images. (a–c) Distributions of saccade amplitudes. The triangles mark the medians of the distributions. The insert panel in (c) displays the range of small amplitudes. (d) Mean amplitudes of microsaccades, defined as saccades smaller than 20' (ANOVA with Scheffe post-hoc comparisons: (*) p = 0.009; (**) p = 0.004). Movies of individual trials in the threading task can be found as Supplementary Videos 1 and 2.
Figure 3
Figure 3
Modulation of saccade characteristics. (a, b) Mean instantaneous frequency of microsaccades, defined as: (a) saccades smaller than 20'; and (b) saccades smaller than 10'. (c) Mean instantaneous saccade amplitude. The two curves in each panel represent data obtained in the presence and absence of background noise. In this latter condition, the background was at a constant grey level and the stimulus was displayed at maximum contrast. Horizontal lines in each panel indicate mean values during sustained fixation (dashed line) and free viewing (dotted line). * marks conditions in which measured values were significantly higher during the last 2.5 s of a trial than during the initial 2.5 s (p < 0.04; one-tailed t-test in a, b and Wilcoxon signed-rank test in c).
Figure 4
Figure 4
Analysis of fixation locations. (a) Each intersaccadic period was classified as a fixation on the eye of the needle, the thread, or the background according to the location of its centroid. The distance D between the needle and the thread varied during the course of the trial. (b) Two examples of spatial distributions of fixations. Each panel corresponds to a different experimental trial. Blue and green circles represent fixations on the thread and on the eye of the needle, respectively. Orange circles indicate fixations on the background. The red crosses mark the trajectory followed by the thread. The insert panels zoom in on the center of the display. (c) Mean probabilities of fixation locations. Differences across all conditions are significant (ANOVA with Scheffe post-hoc comparisons, p < 0.002). (d) Fixation probabilities at successive intervals during the course of the trial.
Figure 5
Figure 5
Analysis of microsaccades. (a) Probabilities of various types of microsaccades during fixation on the needle and on the thread. Microsaccades are subdivided according to where they landed. Data refer to saccades smaller than 20'. (b) Influence of microsaccade direction on the direction of the following microsaccade. During the last 2.5 s in each trial, consecutive microsaccades possessed opposite directions on the horizontal axis. In both graphs, all differences within each group are statistically significant (paired z-test with Bonferroni corrections, p < 0.001).
Figure 6
Figure 6
Interplay between microsaccades and corrections in the thread-needle alignment. (a) Probability distributions of adjustments to the thread's position as a function of the location of fixation during which they occurred. (b) Rates of adjustments. Data points represent the average numbers of changes in the thread's position per fixation. In both a and b, all differences are statistically significant (paired z-test with Bonferroni corrections, p < 0.01). (c–d) Conditional probabilities of adjustments following different types of microsaccades. The fixation in which the adjustment occurred (x-axis) is the target destination of the microsaccade. (ef) Conditional probabilities of performing different types of microsaccades following an adjustment. The fixation in which the adjustment occurred (x-axis) is the origin of the microsaccade. Data are shown for both microsaccades smaller than 20' (c,e) and 10' (d,f). In cf, microsaccades are arranged according to whether they maintained fixation on the same object (thread or needle) or moved the line of sight from one to the other. * marks significant differences (paired z-test with Bonferroni corrections, p < 0.05).

Comment in

  • The eye on the needle.
    Kowler E, Collewijn H. Kowler E, et al. Nat Neurosci. 2010 Dec;13(12):1443-4. doi: 10.1038/nn1210-1443. Nat Neurosci. 2010. PMID: 21102565 No abstract available.

References

    1. Ahissar E, Arieli A. Figuring space by time. Neuron. 2001;32(2):185–201. - PubMed
    1. Collewijn H, Kowler E. The significance of microsaccades for vision and oculomotor control. J. Vis. 2008;8(14:20):1–21. - PMC - PubMed
    1. Rolfs M. Microsaccades: Small steps on a long way. Vision Res. 2009;49(20):2415–2441. - PubMed
    1. Ditchburn RW, Ginsborg BL. Vision with a stabilized retinal image. Nature. 1952;170(4314):36–37. - PubMed
    1. Ditchburn RW, Fender DH, Mayne S. Vision with controlled movements of the retinal image. J. Physiol. 1959;145(1):98–107. - PMC - PubMed

Publication types

MeSH terms