Attentional signatures of perception: multiple object tracking reveals the automaticity of contour interpolation
- PMID: 21038997
- PMCID: PMC6656532
- DOI: 10.1037/a0020674
Attentional signatures of perception: multiple object tracking reveals the automaticity of contour interpolation
Abstract
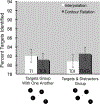
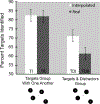
Multiple object tracking (MOT) is an attentional task wherein observers attempt to track multiple targets among moving distractors. Contour interpolation is a perceptual process that fills-in nonvisible edges on the basis of how surrounding edges (inducers) are spatiotemporally related. In five experiments, we explored the automaticity of interpolation through its influences on tracking. We found that (1) when the edges of targets and distractors jointly formed dynamic illusory or occluded contours, tracking accuracy worsened; (2) when interpolation bound all four targets together, performance improved; (3) when interpolation strength was weakened (by altering the size or relative orientation of inducing edges), tracking effects disappeared; and (4) real and interpolated contours influenced tracking comparably, except that real contours could more effectively shift attention toward distractors. These results suggest that interpolation's characteristics-and, in particular, its automaticity-can be revealed through its attentional influences or "signatures" within tracking. Our results also imply that relatively detailed object representations are formed in parallel, and that such representations can affect tracking when they become relevant to scene segmentation.
Figures


Similar articles
-
Classification images reveal spatiotemporal contour interpolation.Vision Res. 2007 Dec;47(28):3460-75. doi: 10.1016/j.visres.2007.10.003. Vision Res. 2007. PMID: 18053850 Clinical Trial.
-
Recovering metric properties of objects through spatiotemporal interpolation.Vision Res. 2014 Sep;102:80-8. doi: 10.1016/j.visres.2014.07.015. Epub 2014 Aug 8. Vision Res. 2014. PMID: 25111311
-
Boundary completion in illusory contours: interpolation or extrapolation?Perception. 2003;32(8):985-99. doi: 10.1068/p3420. Perception. 2003. PMID: 14580144
-
3-d interpolation in object perception: evidence from an objective performance paradigm.J Exp Psychol Hum Percept Perform. 2005 Jun;31(3):558-83. doi: 10.1037/0096-1523.31.3.558. J Exp Psychol Hum Percept Perform. 2005. PMID: 15982131 Review.
-
A theory of visual interpolation in object perception.Cogn Psychol. 1991 Apr;23(2):141-221. doi: 10.1016/0010-0285(91)90009-d. Cogn Psychol. 1991. PMID: 2055000 Review.
Cited by
-
Contour interpolation: A case study in Modularity of Mind.Cognition. 2018 May;174:1-18. doi: 10.1016/j.cognition.2018.01.008. Epub 2018 Feb 3. Cognition. 2018. PMID: 29407601 Free PMC article.
-
Automatic feature-based grouping during multiple object tracking.J Exp Psychol Hum Percept Perform. 2013 Dec;39(6):1625-1637. doi: 10.1037/a0031750. Epub 2013 Mar 4. J Exp Psychol Hum Percept Perform. 2013. PMID: 23458095 Free PMC article.
-
Additivity of Feature-Based and Symmetry-Based Grouping Effects in Multiple Object Tracking.Front Psychol. 2016 May 4;7:657. doi: 10.3389/fpsyg.2016.00657. eCollection 2016. Front Psychol. 2016. PMID: 27199875 Free PMC article.
-
Optimization and validation of a visual integration test for schizophrenia research.Schizophr Bull. 2012 Jan;38(1):125-34. doi: 10.1093/schbul/sbr141. Epub 2011 Oct 20. Schizophr Bull. 2012. PMID: 22021658 Free PMC article.
-
The Categorical Distinction Between Targets and Distractors Facilitates Tracking in Multiple Identity Tracking Task.Front Psychol. 2016 Apr 28;7:589. doi: 10.3389/fpsyg.2016.00589. eCollection 2016. Front Psychol. 2016. PMID: 27199824 Free PMC article.
References
-
- Allen R, McGeorge P, Pearson D & Milne AB (2004). Attention and expertise in multiple target tracking. Applied Cognitive Psychology, 18, 337–347.
-
- Banton T, & Levi D (1992). The perceived strength of illusory contours. Perception & Psychophysics, 52, 676–684. - PubMed
-
- Baylis G & Driver J (1993). Visual location and objects: Evidence for hierarchical coding of location. Journal of Experimental Psychology: Human Perception and Performance. 451–470 - PubMed
-
- Bullot N, & Droulez J (2008). Keeping track of invisible individuals while exploring a spatial layout with partial cues: Location-based and deictic direction-based strategies. Philosophical Psychology, 21(1), 15–46.
-
- Burt P, & Sperling G (1981). Time, distance, and feature trade-offs in visual apparent motion. Psychological Review, 88(2), 171–195. - PubMed

