. 2011 Feb;132(2):226-39.
doi: 10.1111/j.1365-2567.2010.03357.x. Epub 2010 Oct 13.

Anti-tumour synergy of cytotoxic chemotherapy and anti-CD40 plus CpG-ODN immunotherapy through repolarization of tumour-associated macrophages

Affiliations

Anti-tumour synergy of cytotoxic chemotherapy and anti-CD40 plus CpG-ODN immunotherapy through repolarization of tumour-associated macrophages

Ilia N Buhtoiarov et al. Immunology. 2011 Feb.

Abstract

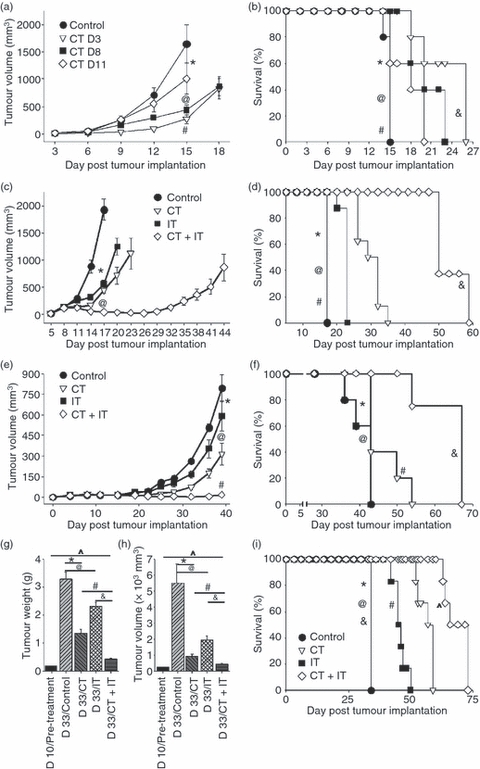
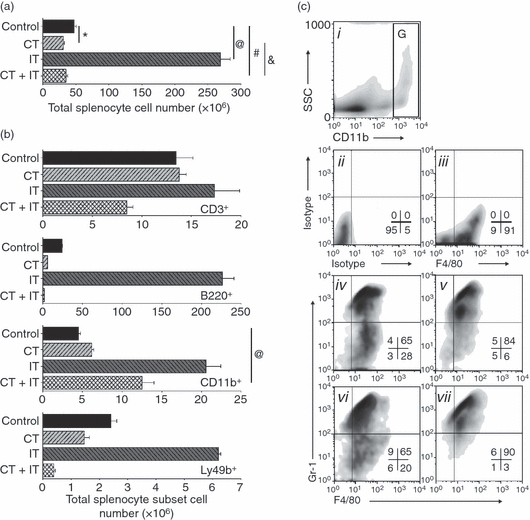
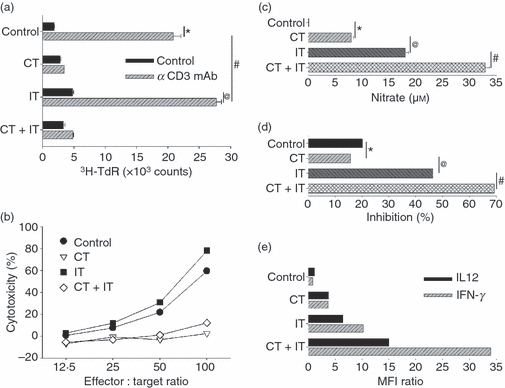
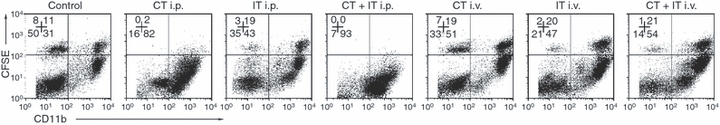
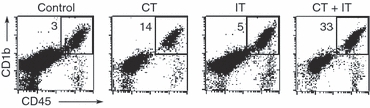
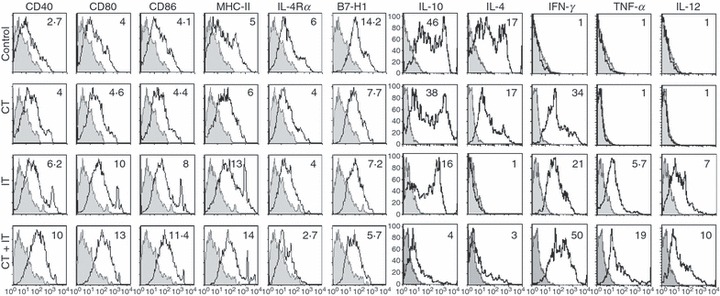
We studied the effectiveness of monoclonal anti-CD40 + cytosine-phosphate-guanosine-containing oligodeoxynucleotide 1826 (CpG-ODN) immunotherapy (IT) in mice treated with multidrug chemotherapy (CT) consisting of vincristine, cyclophosphamide and doxorubicin. Combining CT with IT led to synergistic anti-tumour effects in C57BL/6 mice with established B16 melanoma or 9464D neuroblastoma. CT suppressed the functions of T cells and natural killer (NK) cells, but primed naïve peritoneal macrophages (Mφ) to in vitro stimulation with lipopolysaccharide (LPS), resulting in augmented nitric oxide (NO) production. IT, given after CT, did not restore the responsiveness of T cells and NK cells, but further activated Mφ to secrete NO, interferon-γ (IFN-γ) and interleukin (IL)-12p40 and to suppress the proliferation of tumour cells in vitro. These functional changes were accompanied by immunophenotype alterations on Mφ, including the up-regulation of Gr-1. CD11b(+) F4/80(+) Mφ comprised the major population of B16 tumour-infiltrating leucocytes. CT + IT treatment up-regulated molecules associated with the M1 effector Mφ phenotype [CD40, CD80, CD86, major histocompatibility complex (MHC) class II, IFN-γ, tumour necrosis factor-α (TNF-α) and IL-12] and down-regulated molecules associated with the M2 inhibitory Mφ phenotype (IL-4Rα, B7-H1, IL-4 and IL-10) on the tumour-associated Mφ compared with untreated controls. Together, the results show that CT and anti-CD40 + CpG-ODN IT synergize in the induction of anti-tumour effects which are associated with the phenotypic repolarization of tumour-associated Mφ.


Figures

Figure 1
Figure 1
Chemotherapy (CT) and immunotherapy (IT) synergize in inducing anti-tumour effects in vivo. (a,b) C57BL/6 mice (n = 5 per group) bearing subcutaneous B16 melanoma tumours were treated with CT, via a single intraperitoneal injection, on different days after tumour implantation. Tumour volumes, expressed as mean ± standard error of the mean (SEM), (a) and survival (b) were monitored. (a) *P > 0·05 (control versus CT day 11); @P < 0·02 (control group versus CT day 3 or CT day 8); #P > 0·05 (CT day 3 versus CT day 8). (b) *P > 0·05 (control versus CT day 11); @P = 0·031 (control group versus CT day 3); #P = 0·043 (control group versus CT day 8); &P > 0·05 (CT day 3 versus CT day 8). (c,d) C57BL/6 mice (n = 6 per group) bearing subcutaneous B16 melanoma tumours were treated intravenously with CT on days 8 and 17 after tumour implantation and IT (anti-CD40 on days 11 and 20 plus CpG-ODN 1826 on days 14 and 23 after tumour implantation), alone or in combination. Tumour volumes (c) and mouse survival (d) were monitored. (c) *P < 0.001 (control versus CT or IT); @P < 0·001 (CT or IT versus CT + IT). (d) *P > 0·05 (control versus CT); @P = 0·036 (control versus IT); #P < 0·01 (control versus CT + IT); &P < 0·02 (CT + IT versus either CT or IT). (e,f) C57BL/6 mice (n = 5 per group) bearing subcutaneous 9464D neuroblastoma (NB) tumours were treated intraperitoneally with CT on day 15 after tumour implantation, and IT (anti-CD40 on days 18 and 25 plus CpG on days 21 and 28 after tumour implantation), alone or in combination. Tumour volumes (e) and mouse survival (f) were monitored. (e) *P > 0·05 (control versus IT); @P < 0·006 (control versus CT); #P < 0·007 (CT + IT versus CT or IT). (f) *P > 0·05 (control versus IT); @P < 0·05 (control versus CT); #P > 0·05 (CT versus IT); &P < 0·03 (control versus CT + IT); ^P < 0·05 (CT + IT versus CT or IT). (g–i) C57BL/6 mice (n = 9 per group) bearing intra-adrenal 9464D NB tumours were treated with CT on days 10 and 20 after tumour implantation, and with IT (anti-CD40 on days 13 and 23 plus CpG on days 16 and 26 after tumour implantation), alone or in combination. Mice were monitored for tumour growth by left flank palpation every third day. On day 33 after tumour implantation, when animals of the control group showed symptoms as a result of the large tumour size, all mice of the control group and three randomly selected mice from each of the experimental groups were killed, and tumour weight (g) and volume (h) were calculated and compared with those in mice killed on day 10 after tumour implantation, before the treatment started. The rest of the treated animals were also followed for survival (i). (g) *P = 0·0027, @P = 0·0307, #P = 0·002, &P = 0·0001, ^P = 0·0046. (h) *P = 0·0013, @P = 0·0307, #P = 0·015, &P = 0·009, ^P = 0·017. (i) *P = 0·027 (control versus IT); @P = 0·009 (control versus CT); #P = 0·041 (CT versus IT); &P < 0·001 (control versus CT + IT); ^P < 0·025 (CT + IT versus CT or IT). Presented are the results from one experiment (a,b), and representative of three experiments (c,d) or two experiments (e,f and g,i). D3, day 3; D8, day 8; D11, day 11.
Figure 2
Figure 2
Differential leucodepletion effect of chemotherapy (CT) on splenic T cells, B cells, natural killer (NK) cells and macrophages (Mφ). Naïve non-tumour-bearing C57BL/6 mice (n = 4 per group) were treated (intraperitoneally or intravenously in several different experiments) with CT or immunotherapy (IT), alone or in combination, as described in the Materials and methods, and spleens were harvested on day 7 [i.e. one day after the last treatment; the second injection of phosphate-buffered saline (PBS) for the CT-treatment group, or CpG-ODN for IT and CT + IT treatment groups]. Absolute numbers of total splenocytes (a) or splenic CD3+ T cells, B220+ B cells, CD11b+ Mφ and Ly49+ NK cells (b) were computed based on the total number of cells and cell subset percentages from the flow cytometric analyses. The results are representative of at least three separate experiments. (a) *P = 0·0112, @P = 0·0001, #P = 0·464, &P = 0·3351. (b) (CD11b+) P = 0·022. (c) Splenic cells from mice receiving the treatments indicated below were gated on CD11bhigh cells [region (g) in panel ci for control mice] and analyzed for expression of F4/80 and Gr-1 (ciii–cvii). Panel cii shows the isotype-control staining, in place of the anti-F4/80 and anti-Gr-1. Panel ciii shows staining with anti-F/80 and isotype (for anti-Gr-1) monoclonal antibodies (mAbs). Panels iv–vii show staining with anti-F4/80 and anti-Gr-1 of Mφ from mice treated with vehicles (iv), CT (v), IT (vi) and CT + IT (vii). Numbers in density plots indicate the percentage of events in each quadrant. Data are representative of at least three experiments, with similar results obtained in each.
Figure 3
Figure 3
Differential effect of chemotherapy (CT) treatment on the functions of T cells, natural killer (NK) cells and macrophage (Mφ). (a) Splenocytes from naïve (i.e. non-tumour-bearing) C57BL/6 mice (n = 3 per group) treated intraperitoneally with CT and immunotherapy (IT), alone or in combination, as described in the Materials and methods and in the legend for Fig. 2, were adjusted to 5 × 10⁴ CD3+ T cells/0·1 ml and cultured in 96-microwell tissue culture clusters precoated with αCD3 monoclonal antibody (mAb) or control IgG for 72 hr. Proliferation of splenocytes was measured by the incorporation of [3H]thymidine during the last 6 hr of culture. *P = 0·0001, @P = 0·0001, #P = 0·052. (b) Splenocytes from mice (n = 3 per group) treated intraperitoneally with CT and IT, alone or in combination, were adjusted to 1 × 10⁵/ml of Ly49b+ NK cells and cultured in medium supplemented with 100 U/ml of recombinant human IL-2 for 72 hr. After this in vitro stimulation, the cell suspensions were readjusted to 5 × 10⁵ viable total splenocytes/0·1 ml and tested for lysis of 5 × 10³ NK cell-sensitive 51Cr-labelled YAC-1 cells/0.1 ml at the indicated effector-to-target ratios following 4 hr of co-culture in a final volume of 0·2 ml. The results are presented as percentage of cytotoxicity. (c–d) Peritoneal cells (PC) from mice treated intraperitoneally with CT and IT, alone or in combination, were adjusted to 2·5 × 105 CD11b+F4/80+Mφ/0·1 ml, seeded in 96-microwell clusters, purified for Mφ by adhesion to plastic, and thereafter tested in vitro for nitric oxide (NO) production (c) and inhibition of B16 tumour cell proliferation following 48 hr of co-culture in vitro with 1 × 10³ B16 tumour cells/0·1 ml in medium supplemented with 10 ng/ml of lipopolysaccharide (LPS) (d). (c) *P = 0·01, @P = 0·006, #P = 0·002. (d) *P = 0·7, @P = 0·01, #P = 0·009. (e) PC from CT and/or IT-treated mice (n = 3 per group) were purified for Mφ by adhesion to plastic and cultured for 12 hr in medium supplemented with 1 μm monensin and 10 ng/ml of LPS, followed by flow cytometric assessment of the intracellular expression of IL-12 and IFN-γ. The results are presented as MFI ratios and are representative of at least three separate experiments with similar results obtained in each.
Figure 4
Figure 4
Route of chemotherapy (CT) and immunotherapy (IT) administration affects macrophage (Mφ) survival and phenotype. Twenty-four hours after intraperitoneal implantation of carboxyfluoroscein succinimidyl ester (CFSE)-labelled syngeneic peritoneal cells (PC), C57BL/6 mice (n = 3 per group) received one cycle of CT (day 1 after PC implantation) or IT (anti-CD40 – day 4 post PC implantation followed by CpG-ODN on day 7 post PC implantation), alone or in combination, either intraperitoneally or intravenously On day 8 of the experiment, total (both resident and transplanted) PCs were harvested and tested by flow cytometry for the presence of CFSE+Mφ. To distinguish CFSE+Mφ from other CFSE+PC, as well as from resident CFSEMφ, the total PC samples were additionally stained with anti-CD11–allophycocyanin. The numbers indicate the percentage of events in each quadrant. The data shown are representative of three experiments. i.p., intraperitoneal; i.v., intravenous.
Figure 5
Figure 5
CD11b+ macrophage (Mφ) comprise the major population of CD45+ tumour-infiltrating leucocytes (TIL) in B16 tumours. C57BL/6 mice [n = 3 for control, chemotherapy (CT) and immunotherapy (IT) treatment groups, n = 6 for the CT + IT treatment group] were injected subcutaneously with B16 cells (day 0). Mice were treated with one cycle of CT (day 8) or IT (anti-CD40 on day 11, CpG on day 14), alone or in combination. On day 15 after tumour implantation, the tumours were harvested, processed to a single-cell suspension, and viable cells were studied by flow cytometry for the prevalence of CD45+ (pan-leucocyte marker)/CD11b+ (pan-Mφ marker) cells. The numbers in the right upper quadrants represent the percentage of CD45+CD11b+Mφ (gate) in the pool of total (tumour cells + non-tumour stromal cells + TIL) viable cells. Of the total CD45+ TILs, CD11b+ cells comprised 89% in the control group, 95% in the CT-treatment group, 91% in the IT-treatment group and 94% in the CT + IT-treatment group.
Figure 6
Figure 6
Chemotherapy (CT) and immunotherapy (IT) alter the phenotype and cytokine profile of tumour-associated macrophages (TAM). C57BL/6 mice (n = 3 for control, CT- and IT-treatment groups; n = 6 for the CT + IT-treatment group) bearing established subcutaneous B16 tumours were treated with two cycles of CT or IT, alone or in combination, as described in Fig. 1(c,d). One day after the last treatment [the second phosphate-buffered saline (PBS) injection for the CT-treatment group, or CpG-ODN for the IT- and the CT + IT-treatment groups], the mice were killed and the tumours were harvested and processed to a single-cell suspension. Tumour-associated cells were gated on CD11b+F4/80+ macrophages (Mφ) and analyzed by flow cytometry for expression of various surface antigens and intracellular cytokines (open histograms) as compared with isotype controls (shaded histograms). The mean fluorescence intensity (MFI) ratios (numbers in histograms) were computed as described in the Materials and methods. Data are representative of two separate experiments, with similar results obtained on each occasion.

Similar articles

Cited by

References

    1. Borella L, Green AA, Webster RG. Immunologic rebound after cessation of long-term chemotherapy in acute leukemia. Blood. 1972;40:42–51. - PubMed
    1. Lanfranchi A, Andolina M, Tettoni K, Porta F, Locatelli F, De Manzini A, Candotti F, Albertini A. Functional depletion of T cells by vincristine and methylprednisolone as an in vitro model for the prevention of graft versus host disease. Haematologica. 1992;77:11–5. - PubMed
    1. Multhoff G, Botzler C, Allenbacher A, Issels R. Effects of ifosfamide on immunocompetent effector cells. Cancer Immunol Immunother. 1996;42:251–4. - PMC - PubMed
    1. Ferraro C, Quemeneur L, Prigent AF, Taverne C, Revillard JP, Bonnefoy-Berard N. Anthracyclines trigger apoptosis of both G0-G1 and cycling peripheral blood lymphocytes and induce massive deletion of mature T and B cells. Cancer Res. 2000;60:1901–7. - PubMed
    1. Kimhi O, Drucker L, Neumann A, et al. Fluorouracil induces apoptosis and surface molecule modulation of peripheral blood leukocytes. Clin Lab Haematol. 2004;26:327–33. - PubMed

Publication types

MeSH terms