. 2011 Jan;35(1):47-59.
doi: 10.1111/j.1530-0277.2010.01321.x. Epub 2010 Oct 6.

Mechanisms by which chronic ethanol feeding limits the ability of dendritic cells to stimulate T-cell proliferation

Affiliations

Mechanisms by which chronic ethanol feeding limits the ability of dendritic cells to stimulate T-cell proliferation

Ji Fan et al. Alcohol Clin Exp Res. 2011 Jan.

Abstract

Background: As initiators of immune responses, dendritic cells (DCs) are required for antigen (Ag)-specific activation of naïve T cells in the defense against infectious agents. The increased susceptibility to and severity of infection seen in chronic alcoholics could be because of impaired DCs initiation of naïve T-cell responses. Specifically, these DCs may not provide adequate Signals 1 (Ag presentation), 2 (costimulation), or 3 (cytokine production) to these T cells.

Methods: Using the Meadows-Cook murine model of chronic alcohol abuse, the ability of ethanol (EtOH)-exposed DCs to stimulate T-cell proliferation, acquire and process Ag, express costimulatory molecules, and produce inflammatory cytokines was assessed.

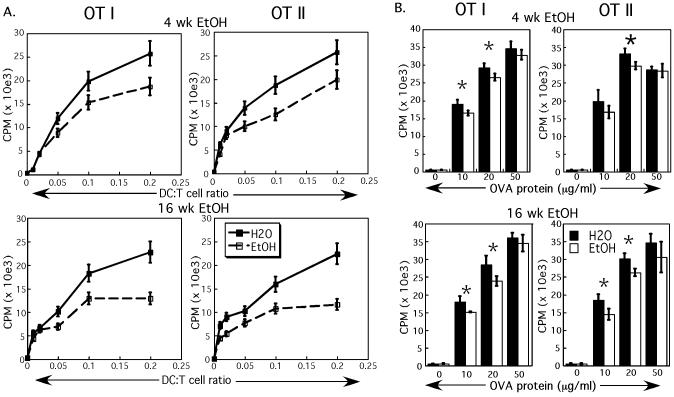
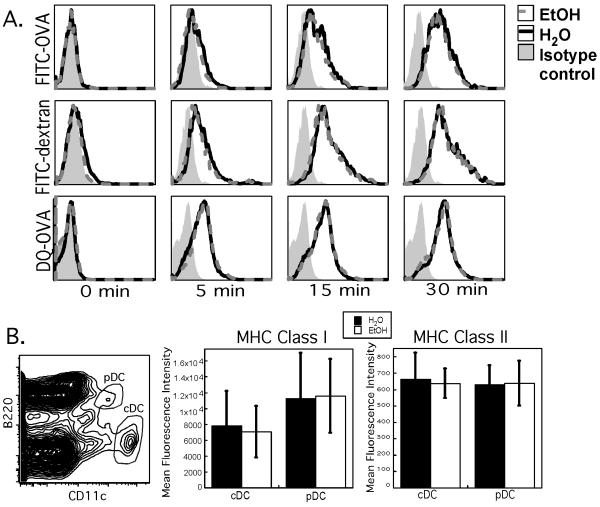
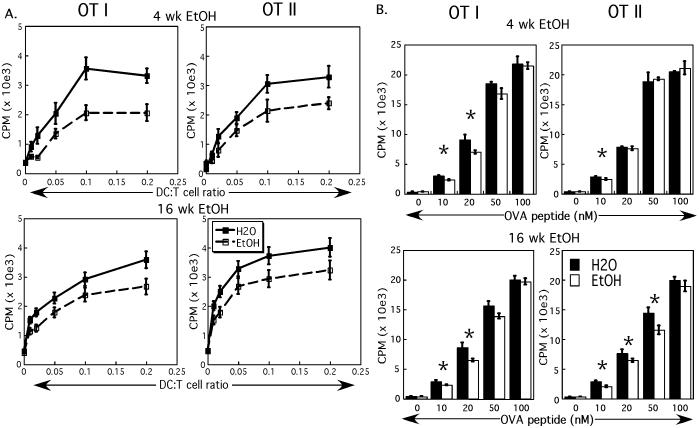
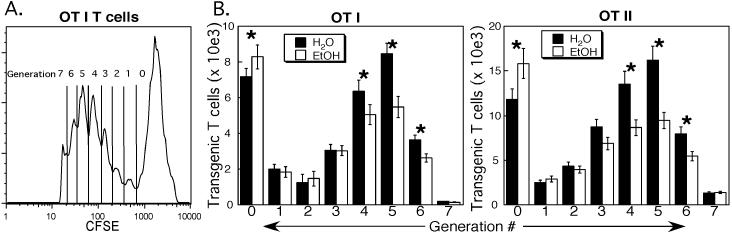
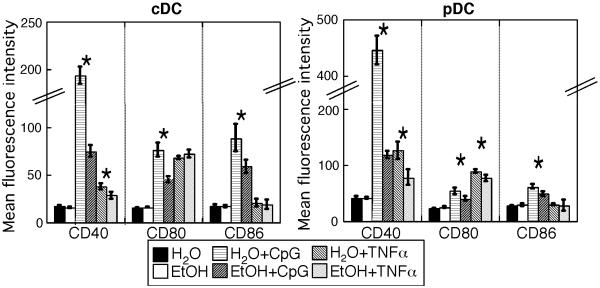
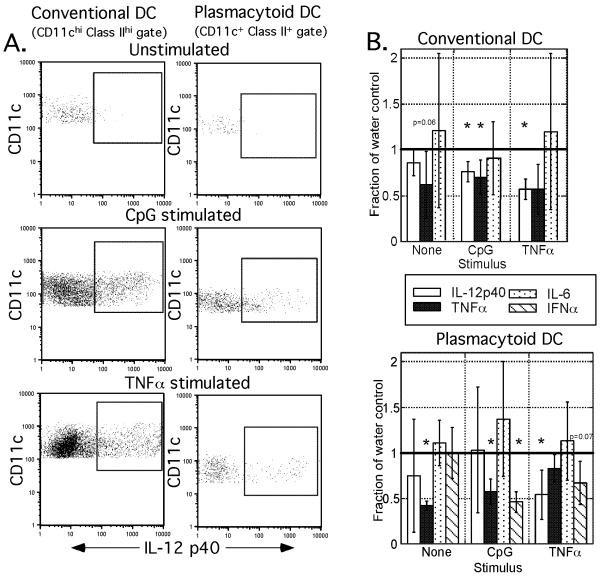
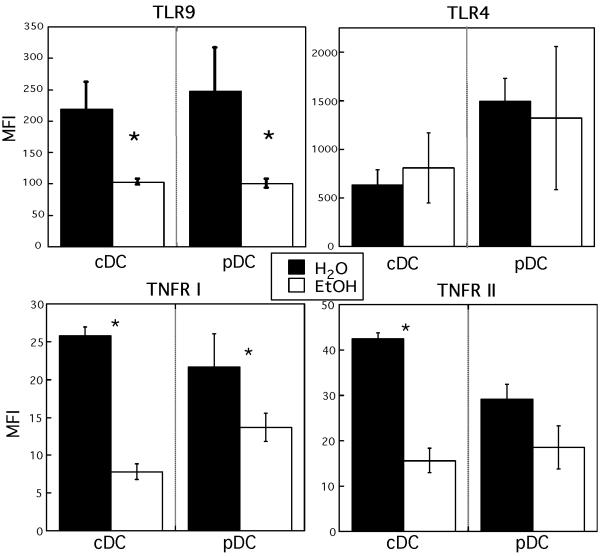
Results: Normal naïve T cells primed by EtOH-exposed DCs showed decreased proliferation in vitro and in vivo, compared to water-fed control mice. These EtOH-exposed DCs, after activation by CpG or tumor necrosis factor alpha (TNFα), were less able to upregulate costimulatory molecules CD40, CD80, or CD86, and produced less IL-12 p40, TNFα, and IFNα than DCs from water-fed mice. TLR9 and TNF receptor expression were also reduced in/on EtOH-exposed DCs. No evidence of defective Ag acquisition or processing as a result of EtOH feeding was identified.

Conclusions: Inadequate proliferation of normal T cells following stimulation by EtOH-exposed DCs is likely a result of diminished Signal 2 and Signal 3. Lack of adequate inflammatory stimulation of EtOH-exposed DCs because of diminished receptors for inflammatory mediators appears to be at least partially responsible for their dysfunction. These findings provide a mechanism to explain increased morbidity and mortality from infectious diseases in alcoholics and suggest targets for therapeutic intervention.


Figures

Figure 1
Figure 1
Chronic EtOH feeding inhibits the ability of DC to promote Ag-specific T cell proliferation in response to OVA protein in vitro. (A) DC from mice fed EtOH for 4 or 16 weeks or control mice were pulsed with 10 μg/ml OVA protein and cultured with T cells from OTI or OTII mice at various ratios of DC:T cells (2×10⁵ T cells/well). T cell proliferation was measured by 3H-thymidine incorporation. Data shown are representative of 3 independent experiments per Tg T cell type; error bars represent standard deviation (SD) between the replicates in the experiment. OTII curves are statistically different (p=0.02 at 4 wk and p=0.03 at 16 wk), and OTI curves trend similarly at both time points. (B) 2×10⁴ DCs from mice fed EtOH for 4 or 16 weeks or control mice were pulsed with various concentrations of OVA protein and cultured with 2×10⁵ T cells from OTI or OTII mice. T cell proliferation was measured as in (A). N=3 mice/group; error bars represent SD.
Figure 2
Figure 2
Chronic EtOH feeding has no effect on multiple aspects of DC Ag acquisition and processing. (A) Splenic DC from 16 wk EtOH fed mice or controls were incubated with FITC-OVA, FITC-dextran or DQ-OVA for 0-30 min. FITC fluorescence was identified by flow cytometry. Data shown are representative of 3 independent experiments per Ag type. (B) Splenic DC from mice fed EtOH for 16 weeks or control mice were stained to identify cDC and pDC (CD11chiB220, and CD11cmodB220+ respectively; 2% probability contour plot), as well as MHC Class I or Class II. N=6-8 mice/group; error bars represent SD.
Figure 3
Figure 3
Chronic EtOH feeding inhibits the ability of DC to promote Ag-specific T cell proliferation in response to OVA peptide in vitro. (A) DC from mice fed EtOH for 4 or 16 weeks or control mice were pulsed with 10 nM OVA peptide 258-264 or 323-339 and cultured with T cells from OTI or OTII mice respectively at various ratios of DC:T cells (2×10⁵ T cells/well). T cell proliferation was measured by 3H-thymidine incorporation. Data shown are representative of 3 independent experiments per transgenic T cell type; error bars represent SD between the replicates in the experiment. OTI and OTII curves are statistically different (p=0.01for both OTI and OTII at 4 wk, p=0.003 for OTI and 0.0003 for OTII at 16 wk). (B) 2×10⁴ DCs from mice fed EtOH for 4 or 16 weeks or control mice were pulsed with various concentrations of OVA peptide 258-264 or 323-339 and cultured with 2×10⁵ T cells from OTI or OTII mice. T cell proliferation was measured as in (A). N=3 mice/group; error bars represent SD.
Figure 4
Figure 4
Chronic EtOH feeding inhibits the ability of DC to promote Ag-specific T cell proliferation in response to OVA peptide in vivo. Splenocytes from OTI or OTII mice were labeled with CFSE and transferred into C57Bl/6 mice. Twenty-four hours later, DC from mice fed EtOH for 16 weeks or control mice were pulsed with 100 nM OVA peptide 258-264 or 323-339 and transferred into the same recipients. Four days following T cell transfer, residual CFSE labeling in splenic Tg CD8+ or CD4+ T cells was studied. (A) Representative CFSE staining on OTI T cells from an EtOH mouse. (Generation numbers correspond to number of times a cell has divided since CFSE labeling.) (B) Number of Tg T cells recovered in each generation. N=3 mice/group; error bars represent SD.
Figure 5
Figure 5
Chronic EtOH feeding results in decreased upregulation of certain costimulatory molecules on DC following inflammatory stimulation in vivo. Costimulatory molecule expression was measured on DC from mice fed EtOH for 16 weeks or control mice, following in vivo treatment with CpG 1826, TNFα, or vehicle alone. Mean fluorescence intensity of costimulatory molecule expression on cDC and pDC at baseline or 24 h following stimulation. DC subsets were identified as in Figure 2B. N=4 mice/group; error bars represent SD.
Figure 6
Figure 6
Chronic EtOH feeding results in decreased production of certain cytokines by DC relative to water controls following inflammatory stimulation in vitro. Enriched splenic DC preparations from mice fed EtOH for 4-16 weeks (changes consistent over this interval) or control mice were stimulated in vitro with CpG 1826 or TNFα in the presence of brefeldin followed by intracellular staining to identify cDC and pDC as well as cytokine production. (A) Representative identification of IL-12 p40 producing cDC (left column) and pDC (right column) in a control mouse. CD11chiClass IIhi cells were B220, and CD11c+Class II+ cells were verified to be B220+ (data not shown). (B) Percentages of cDC and pDC populations from EtOH fed mice that produced the indicated cytokines without stimulation, or following stimulation with CpG 1826 or TNFα normalized to those from water controls (represented as 1). N=5 mice/group for IL-12p40, TNFα and IFNα, and N=8 for IL-6. Error bars represent SD.
Figure 7
Figure 7
Chronic EtOH feeding downregulates TLR9 and TNFR expression in/on DC. Splenic DC from mice fed EtOH for 16 weeks or control mice were permeabilized and stained to identify cDC and pDC (similar to Figure 2B), as well as TLR9, TLR4, TNFRI, and/or TNFRII expression. N=4 mice/group; error bars represent SD.

Similar articles

Cited by

References

    1. Aggarwal S, Ghilardi N, Xie MH, de Sauvage FJ, Gurney AL. Interleukin-23 promotes a distinct CD4 T cell activation state characterized by the production of interleukin-17. J Biol Chem. 2003;278:1910–1914. - PubMed
    1. Aloman C, Gehring S, Wintermeyer P, Kuzushita N, Wands JR. Chronic ethanol consumption impairs cellular immune responses against HCV HS5 protein due to dendritic cell dysfunction. Gastroenterol. 2007;132:698–708. - PubMed
    1. Bafica A, Santiago HC, Goldszmid R, Ropert C, Gazzinelli RT, Sher A. TLR9 and TLR2 signaling together account for MyD88-dependent control of parasitemia in Trypanosoma cruzi infection. J Immunol. 2006;177:3515–3519. - PubMed
    1. Bafica A, Scanga CA, Feng CG, Leifer C, Cheever A, Sher A. TLR9 regulates Th1 responses and cooperates with TLR2 in mediating optimal resistance to Mycobacterium tuberculosis. J Exp Med. 2005;202:1715–1724. - PMC - PubMed
    1. Barchet W, Cella M, Colonna M. Plasmacytoid dendritic cells--virus experts of innate immunity. Semin Immunol. 2005;17:253–261. - PubMed

Publication types

MeSH terms