. 2010 Nov;32(10):1646-57.
doi: 10.1111/j.1460-9568.2010.07408.x. Epub 2010 Oct 8.

Analysis of distinct short and prolonged components in rebound spiking of deep cerebellar nucleus neurons

Affiliations

Analysis of distinct short and prolonged components in rebound spiking of deep cerebellar nucleus neurons

Thomas Sangrey et al. Eur J Neurosci. 2010 Nov.

Abstract

Deep cerebellar nucleus (DCN) neurons show pronounced post-hyperpolarization rebound burst behavior, which may contribute significantly to responses to strong inhibitory inputs from cerebellar cortical Purkinje cells. Thus, rebound behavior could importantly shape the output from the cerebellum. We used whole-cell recordings in brain slices to characterize DCN rebound properties and their dependence on hyperpolarization duration and depth. We found that DCN rebounds showed distinct fast and prolonged components, with different stimulus dependence and different underlying currents. The initial depolarization leading into rebound spiking was carried by hyperpolarization-activated cyclic nucleotide-gated current, and variable expression of this current could lead to a control of rebound latency. The ensuing fast rebound burst was due to T-type calcium current, as previously described. It was highly variable between cells in strength, and could be expressed fully after short periods of hyperpolarization. In contrast, a subsequent prolonged rebound component required longer and deeper periods of hyperpolarization before it was fully established. We found using voltage-clamp and dynamic-clamp analyses that a slowly inactivating persistent sodium current fits the conductance underlying this prolonged rebound component, resulting in spike rate increases over several seconds. Overall, our results demonstrate that multiphasic DCN rebound properties could be elicited differentially by different levels of Purkinje cell activation, and thus create a rich repertoire of potential rebound dynamics in the cerebellar control of motor timing.


Figures

Figure 1
Figure 1
Rebound spiking of three different neurons in response to −200 pA current injection illustrates the observed range of rebound characteristics. The insets above each rebound pointed to by arrows show the initial 300 ms of each rebound at an expanded time scale. In neuron 1, a distinct fast rebound burst (FRB) was followed by a prolonged rebound Period (PRP), in which spiking was still significantly elevated above baseline. Neuron 2 showed only a weak FRB but a similar PRP, while neuron 3 showed a strong initial FRB followed by a pause and a secondary fast burst before a less pronounced PRP ensued. The left axis denotes mV of membrane potential, while the right axis denotes instantaneous firing frequency shown by the grey diamond symbols denoting 1 / ISI in Hz for each ISI beyond 300 ms post-stimulus. As further described in Methods, the PRP frequency was quantified by fitting a linear regression line to the frequency given by the first 10 ISIs occurring 300 ms post-stimulus. The solid line between the diamonds (between 2.3 and 2.6 s on the time axis) denotes this regression and the intercept at 300 ms post stimulus (2.3 s on the time axis) is denoted by a grey star. The PRP frequency increase was calculated from this intercept by subtracting the pre-stimulus spontaneous firing rate.
Figure 2
Figure 2
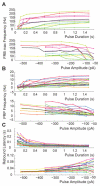
Dependence of FRB and PRP rebound components on stimulus duration and amplitude. A) Data are shown for neurons that showed an FRB component for at least the highest stimulation amplitude (11 of 18 neurons). Each line represents the rebound properties of a single neuron. Upper Panel: In most neurons, the FRB reached a maximal frequency when the duration of the preceding hyperpolarizing stimulus (−200 pA amplitude) exceeded 250 ms. Lower Panel: FRB frequency also depended on the amplitude of the stimulus and typically reached a maximum when the preceding stimulus exceeded −150 pA (1s stimulus duration). FRB frequency was calculated using the first ISI of the rebound if an FRB was detected (See Methods). B) The influence of stimulus amplitude and duration for the PRP is shown for all 18 cells. Note the more gradual effect of stimulus duration and amplitude on the PRP than the FRB, suggesting a different underlying voltage dependence of the PRP rebound conductance. C) The latency to first spike following the offset of a hyperpolarizing pulse (n = 16 cells) showed a strong increase at short stimulus durations and graded dependence on stimulus amplitudes. Identical colors in different subpanels correspond to the same cells.
Figure 3
Figure 3
Significance in differences for rebound properties for short vs. long and small vs. large stimuli. Double asterisks denote a P-value of < 0.01. For determining the effect of stimulus duration the stimulus amplitude was held at −200 pA, and for determining the effect of stimulus amplitude the duration was held at 1s. A) Fast burst frequency increased by 800% between stimulus durations of 60 ms and 1.5 s for neurons with a full FRB response at −200 pA input. An increase in stimulus amplitude from −50 to −355 pA lead to an FRB increase by 270% for stimuli of 1s duration. B) Rebound latency was 4 times longer for short stimulus durations and 2 times longer for small stimulus amplitudes. C) The PRP rate increased by an average of 680% as the stimulus duration was increased from 60 ms to 1.5 s and by 250% as hyperpolarizing stimulus magnitude increased from 50 pA to 355 pA.
Figure 4
Figure 4
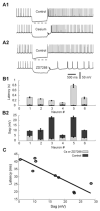
HCN current controls latency to rebound spiking. A) Two representative cells are shown before and after HCN block. In neuron 1 (A1) HCN was blocked with cesium (5 mM), in neuron 2 (A2) with ZD7288 (60 μM). The stimulus current was reduced after HCN block to yield the same membrane potential at the end of the stimulus. This allowed us to examine the delay to rebound offset from the same preceding potential before and after HCN block. Following HCN block, the latency to rebound was strongly increased and a continued burst pattern developed in 2 of 6 cells (example in A2). Note that both the FRB and PRP rebound components remained present when bursting did not occur (A1). B1) For six cells, bar plots compare the rebound latency in control (dark) versus HCN block (light). Neuron 1 corresponds to the same cell shown in A2 and was blocked using ZD7288 while all other cells were blocked using cesium. B2) The same 6 cells showed a pronounced voltage sag during hyperpolarizing stimuli (dark area of bars) in control trials (sag period indicated by dashed lines in A1,A2) that was mostly abolished after HCN block (light area of bars). C) A linear relationship between sag amplitude and rebound latency prior to HCN block shows a significant negative linear correlation (r2 = 0.77, P=0.0020, n = 9 cells, including the 6 shown in B).
Figure 5
Figure 5
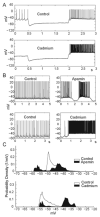
Calcium Current is not responsible for PRP but controls stability through SK channel activation. A) The nonspecific calcium channel blocker cadmium (125 μM) resulted in a dramatic increase in PRP frequency indicating that the plateau current underlying it is not calcium dependent (n = 6 cells). B) Both apamin and cadmium result in similar loss of firing stability and lead to periods of high frequency firing, even in the absence of current pulse stimulation. C) The probability distribution of membrane potential (after digital removal of action potentials) was unimodal before cadmium or apamin application, but bimodal afterwards. This bimodality indicates the presence of separate up- and down states in the presence of these blockers. The y-axis is normalized so that the area under each probability density curve is 1.
Figure 6
Figure 6
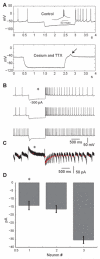
The PRP is sodium current dependent and reflects the time course of persistent sodium current inactivation. A) In the presence of cesium and TTX a small depolarizing transient with the timing of the FRB remains (Fig. 6A, arrow), but no prolonged rebound depolarization that could trigger the PRP is present (n = 6 cells). B) Three current clamp traces are shown from separate cells subjected to a −500 pA current injection pulse. Each trace was subsequently used as a command waveform in voltage clamp mode in the presence of apamin (100 nM) and subsequently in the presence of apamin (100 nM) and TTX (1 μM). Subtracting post-TTX traces from pre-TTX ones allowed us to investigate the dynamics of sodium current activation with natural rebound spike patterns. C) An example of TTX sensitive current is shown for the neuron corresponding to the top trace in panel in panel B (starred * trace). A long lasting inward current followed the offset of the hyperpolarized period of the command potential (time course of command potential is depicted by starred * trace in panel B). The voltage-clamp current shown is an average of 10 TTX-subtracted trials. Action potential currents are truncated. Red boxes denote the averaged current during each interspike interval. D) TTX sensitive current was averaged during the first second of the rebound period for each of the neurons shown in B. Star (*) denotes the same neuron as in panel C. Standard error bars denote between-trial variability (n = 10 trials).
Figure 7
Figure 7
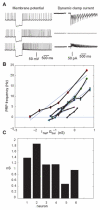
Dynamic clamp application of a persistent sodium current (INaP) to the soma replicated the endogenous current underlying the PRP. A) INaP conductance was subtracted (NaPvalue of −0.83 nS, top trace) or added (NaP values of 0.3 nS, bottom trace) with dynamic clamping during current clamp recording of a neuron expressing a typical PRP (middle trace, no applied INaP). A negative value of NaP means that the additive inverse of the current was injected into the cell to cancel an endogenous INaP component. In each trace, a 1s hyperpolarizing current pulse of −300 pA was used to trigger deinactivation of endogenous and applied INaP. B) The PRP frequency (calculated as in Fig 1, see Methods) was positively correlated with the magnitude of applied NaP. Each line represents a different neuron (n = 6) and error bars depict SEM between 12 repeated trials. Thin blue lines present linear fits to the relation between PRP frequency and applied NaP. for each neuron. C) Predicted endogenous NaP is plotted as a bar graph for each cell from the data in B. Intercepts with zero as the point where the PRP caused by endogenous current was exactly canceled by applied negative NaP were calculated from linear fits for each neuron depicted in B.
Figure 8
Figure 8
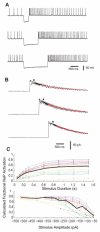
The dependence of endogenous PRP frequency on stimulus duration and amplitude is well matched with the kinetics of artificial INaP. A) Representative traces showing increased PRP frequency of one neuron with increasing stimulus duration. B) Simulation of artificial INaP time course during the traces shown in A. These traces were calculated by forcing the kinetics of our simulated INaP to follow the recorded voltage trace and using a NaP value approximating the endogenous value as determined from the intercept in Fig. 7B for this neuron. Asterisks denote the 300 ms post-stimulus time at which PRP frequency was scored (see Methods). C) The fraction of open NaP conductance at the offset of a hyperpolarizing current pulse was calculated from our artificial NaP kinetics for each cell shown in Fig. 2 as a function of stimulus duration and amplitude. Fractional NaP conductance was determined from simulations using the voltage traces of the original recordings as a voltage input to our artificial NaP conductance. The thicker black line denotes the average. A good match between NaP fractional conductance and PRP frequency shown in Fig. 2 was found.

Similar articles

Cited by

References

    1. Aizenman CD, Huang EJ, Linden DJ. Morphological correlates of intrinsic electrical excitability in neurons of the deep cerebellar nuclei. J Neurophysiol. 2003;89:1738–1747. - PubMed
    1. Aizenman CD, Linden DJ. Regulation of the rebound depolarization and spontaneous firing patterns of deep nuclear neurons in slices of rat cerebellum. J Neurophysiol. 1999;82:1697–1709. - PubMed
    1. Aizenman CD, Manis PB, Linden DJ. Polarity of long-term synaptic gain change is related to postsynaptic spike firing at a cerebellar inhibitory synapse. Neuron. 1998;21:827–835. - PubMed
    1. Alvina K, Walter JT, Kohn A, Ellis-Davies G, Khodakhah K. Questioning the role of rebound firing in the cerebellum. Nature Neuroscience. 2008;11:1256–1258. - PMC - PubMed
    1. Alzheimer C, Schwindt PC, Crill WE. Modal gating of Na+ channels as a mechanism of persistent Na+ current in pyramidal neurons from rat and cat sensorimotor cortex. J. Neurosci. 1993;13:660–673. - PMC - PubMed

Publication types