. 2010 Dec;43(6):562-72.
doi: 10.1111/j.1365-2184.2010.00705.x.

Assessment of cell proliferation and muscular structure following surgical tongue volume reduction in pigs

Affiliations

Assessment of cell proliferation and muscular structure following surgical tongue volume reduction in pigs

W Ye et al. Cell Prolif. 2010 Dec.

Abstract

Objectives: Tongue volume reduction is an adjunct treatment in several orofacial orthopaedic procedures for various craniofacial deformities; it may affect structural reconstitution and functional recovery as a result of the repair process. The aim of this study was to investigate myogenic regeneration and structural alteration of the tongue following surgical tongue volume reduction.

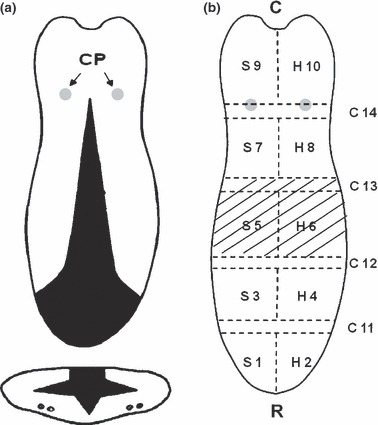
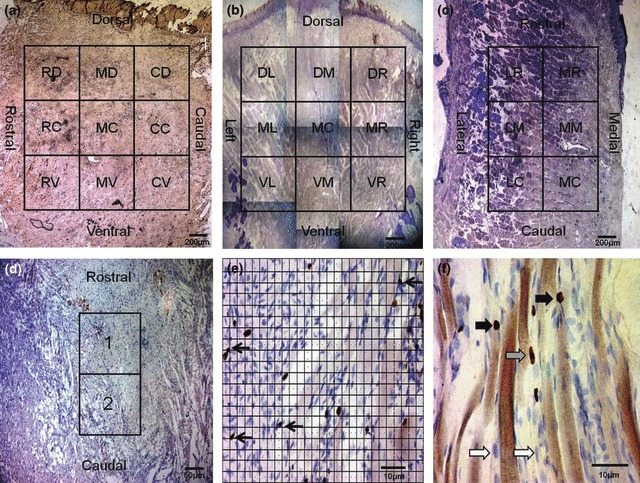
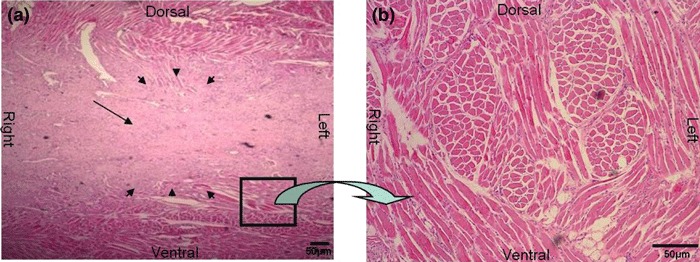
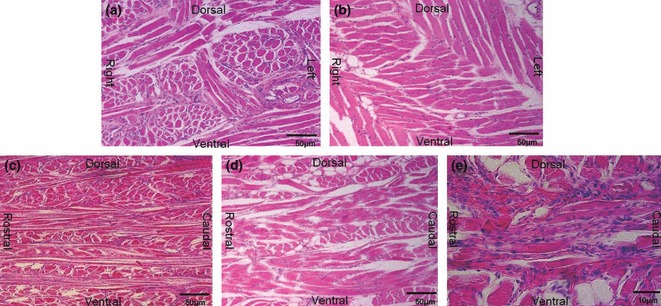
Materials and methods: Five 12-week-old sibling pairs of Yucatan minipigs (three males and two females) were used. Midline uniform glossectomy was performed on one of each pair (reduction); siblings had identical incisions without tissue removal (sham). All pigs were raised for a further 4 weeks and received 5-bromo-2-deoxyuridine (BrdU) injection intravenously 1 day before killing. Tissue sections of tongues were stained with anti-BrdU antibody to evaluate numbers of replicating cells. Haematoxylin and eosin plus trichrome staining were performed to assess muscular structure.

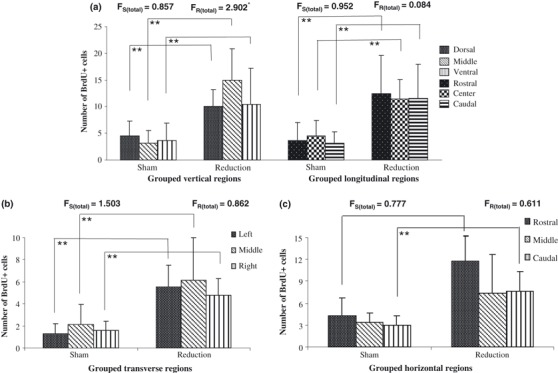
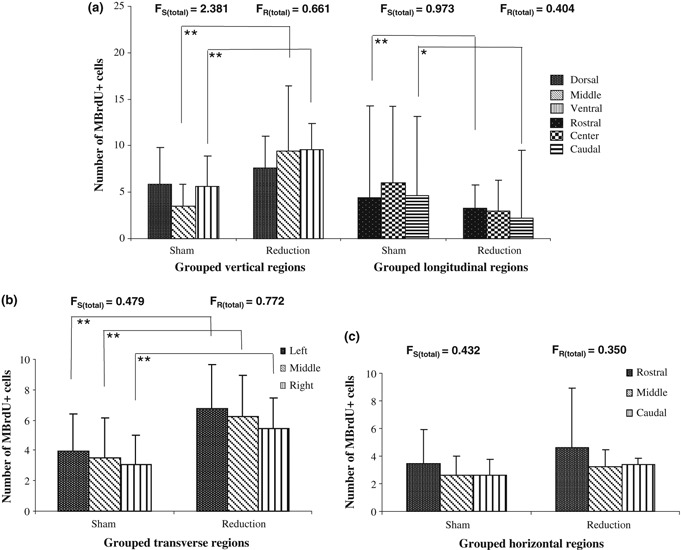
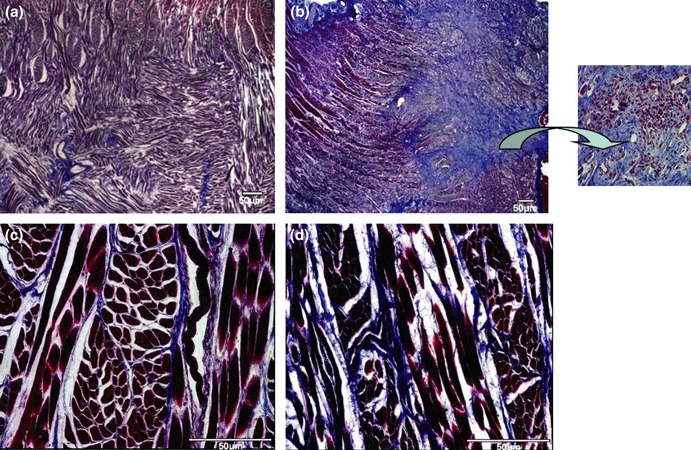
Results: Reduction tongues contained significantly more BrdU+ cells compared to sham tongues (P < 0.01). However, these BrdU+ cells were mostly identified in reparative connective tissues (fibroblasts) rather than in regenerating muscle tissue (myoblasts). Trichrome-stained sections showed disorganized collagen fibres linked to few intermittent muscle fibres in the reduction tongues. These myofibres presented signs of atrophy with reduced perimysium and endomysium. Matrix between reduced perimysium and endomysium was filled with fibrous tissue.

Conclusions: Fibrosis without predominant myogenic regeneration was the major histological consequence of surgical tongue volume reduction.


Figures

Figure 1
Figure 1
Schema of tongue volume reduction surgery and demarcation of histological sections. (a) Surgical incision lines in dorsal and cross‐sectional views. Black portions of diagram depict the removed tongue tissue. CP, circumvallate papilla. Dots indicate the location of the neurovascular bundles in the ventral area of the tongue. (b) Schematic of locations for histological sections from three directions of the tongue. R, Rostral; c, Caudal; S, sagittal sectioning; C, coronal sectioning; H, horizontal sectioning. The hatched section is the central part of surgery‐involving area which was used for anti‐BrdU staining.
Figure 2
Figure 2
Regional assignment for cell counting and illustrations of cell counting and cell types. (a) 1× image of sagittal section, which was divided into nine subregions: rostral dorsal (RD), middle dorsal (MD), caudal dorsal (CD), rostral centre (RC), middle centre (MC), caudal centre (CC), rostral ventral (RV), middle ventral (MV) and caudal ventral (CV). (b) 1× image of coronal section, which was also divided into nine subregions: dorsal right (DR), dorsal middle (DM), dorsal left (DL), middle right (MR), MC, middle left (ML), ventral right (VR), ventral middle (VM) and ventral left (VL). (c) 1× image of horizontal section, which was further divided into six subregions: medial rostral (MR), medial middle (MM), medial caudal (MC), lateral rostral (LR), lateral middle (LM) and lateral caudal (LC). (d) 4× image showing two sampling fields (1, central‐top; 2, central‐bottom) in each subregions above. (e) 40× image showing the methods for BrdU+ cells counts (arrows) using a calibrated grid. (f) 60× image showing different cell types. BrdU+ fibroblast nuclei (stripped arrows); BrdU+ myofibre nuclei (solid arrows); BrdU− cells (empty arrows).
Figure 3
Figure 3
Comparisons of the total BrdU+ cells for grouped regions between the reduction and sham tongues. (a) sagittal sections, showing the cell populations in the grouped vertical and longitudinal regions; (b) coronal sections, showing the cell populations in the grouped transverse region; (c) horizontal sections, showing the cell populations in the grouped horizontal region. *P < 0.05; **P < 0.01.
Figure 4
Figure 4
Comparisons of BrdU+ myonuclei (MBrdU+) cells for grouped regions between the reduction and sham tongues. (a) sagittal sections, showing the cell populations in the grouped vertical and longitudinal regions; (b) coronal sections, showing the cell populations in the grouped transverse region; (c) horizontal sections, showing the cell populations in the grouped horizontal region. *P < 0.05; **P < 0.01.
Figure 5
Figure 5
Pattern of muscle repair after the surgery (H&E staining). (a) a 4× coronal image from a reduction tongue, showing the scar tissue in the middle centre area (MC); the centripetal repair was shown by small arrows. (b) a 10× coronal image from the insert area of the image (a), showing a number of intermeshed myofibres surrounding the scar tissue.
Figure 6
Figure 6
Muscular structures in the sham and reduction tongues (H&E staining). (a) a 10× coronal image from a sham tongue. (b) a 10× coronal image from a reduction tongue. (c) a 10× sagittal image from a sham tongue. (d) a 10× sagittal image from a reduction tongue. (e) a 40× sagittal image from a reduction tongue.
Figure 7
Figure 7
Muscular structures in the sham and reduction tongues (trichrome staining). (a and b) 4× horizontal images showing muscular structure from sham (a) and reduction (b) tongues. Note that the collagen fibres and myofibres alignment are arranged in a well‐organized fashion in the sham tongue. However, the amounts of connective tissues are significantly higher in the reduction tongue compared with the sham tongue. The insert area of image (b) shows disorganized collagen fibres linked with a few intermittent muscle fibres. (c and d) 20× sagittal images showing the endomysium and perimysium from sham (c) and reduction (d) tongues. Note that myofibres (red) present atrophy with the reduced endomysium and perimysium, and fibrous tissues (blue) are fully interposed between the atrophied myofibres.

References

    1. Liu ZJ, Shcherbatyy V, Perkins JA (2008b) Functional loads of the tongue and consequences of volume reduction. J. Oral Maxillofac. Surg. 66, 1351–1361. - PMC - PubMed
    1. Liu ZJ, Shcherbatyy V, Gu G, Perkins JA (2008a) Effects of tongue volume reduction on craniofacial growth: a longitudinal study on orofacial skeletons and dental arches. Arch. Oral Biol. 53, 991–1001. - PMC - PubMed
    1. Davalbhakta A, Lamberty BG (2000) Technique for uniform reduction of macroglossia. Br. J. Plast. Surg. 53, 294–297. - PubMed
    1. Gasparini G, Saltarel A, Carboni A, Maggiulli F, Becelli R (2002) Surgical management of macroglossia: discussion of 7 cases. Oral Surg. Oral Med. Oral Pathol. Oral Radiol. Endod. 94, 566–571. - PubMed
    1. Herren P, Muller‐Boschung P, Stutz G (1981) Macroglossia and partial resection of the tongue out of orthodontic indication. Proc. Finn. Dent. Soc. 77, 45–55. - PubMed

Publication types