

Widespread proliferation impairment and hypocellularity in the cerebellum of fetuses with down syndrome
- PMID: 21040072
- PMCID: PMC8094247
- DOI: 10.1111/j.1750-3639.2010.00459.x
Widespread proliferation impairment and hypocellularity in the cerebellum of fetuses with down syndrome
Abstract
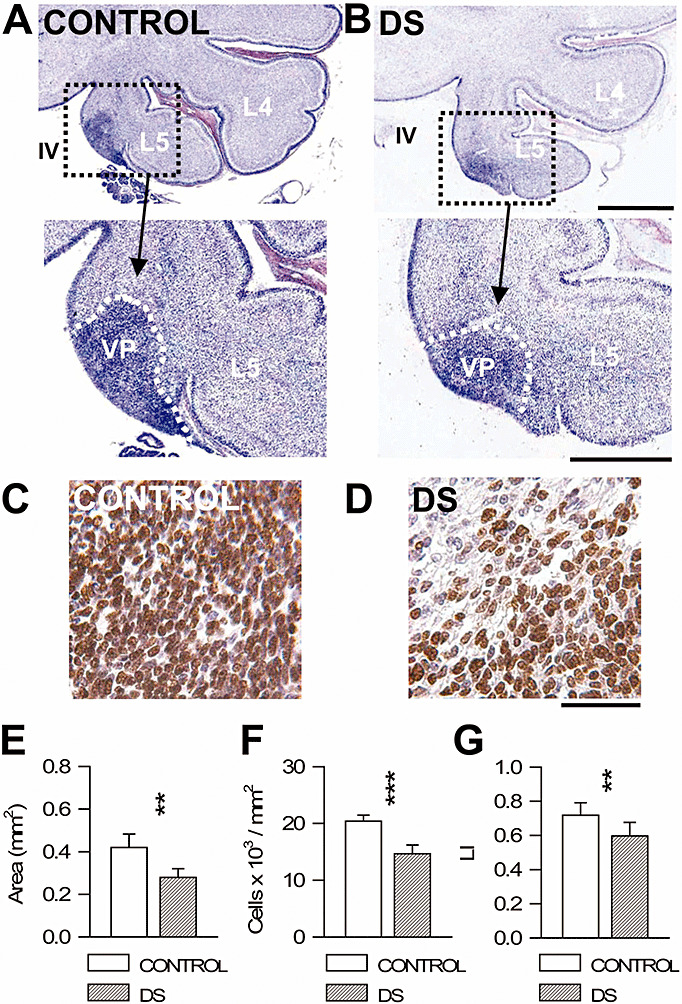
Evidence in mouse models for Down syndrome (DS) and human fetuses with DS clearly shows severe neurogenesis impairment in various telencephalic regions, suggesting that this defect may underlie the cognitive abnormalities of DS. As cerebellar hypotrophy and motor disturbances are part of the clinical features of DS, the goal of our study was to establish whether these defects may be related to neurogenesis impairment during cerebellar development. We found that in fetuses with DS (17-21 weeks of gestation) the cerebellum had an immature pattern, a reduced volume and notably fewer cells (-25%/-50%) in all cerebellar layers. Immunohistochemistry for Ki-67, a marker of cycling cells, showed impaired proliferation (-17%/-50%) of precursors from both cerebellar neurogenic regions (external granular layer and ventricular zone). No differences in apoptotic cell death were found in DS vs. control fetuses. The current study provides novel evidence that in the cerebellum of DS fetuses there is a generalized hypocellularity and that this defect is due to proliferation impairment, rather than to an increased cell death. The reduced proliferation potency found in the DS fetal cerebellum, in conjunction with previous evidence, strengthens the idea that the trisomic brain is characterized by widespread neurogenesis disruption.
© 2010 The Authors; Brain Pathology © 2010 International Society of Neuropathology.
Figures


Similar articles
-
Neurogenesis impairment and increased cell death reduce total neuron number in the hippocampal region of fetuses with Down syndrome.Brain Pathol. 2008 Apr;18(2):180-97. doi: 10.1111/j.1750-3639.2007.00113.x. Epub 2007 Dec 17. Brain Pathol. 2008. PMID: 18093248 Free PMC article.
-
Cell cycle alteration and decreased cell proliferation in the hippocampal dentate gyrus and in the neocortical germinal matrix of fetuses with Down syndrome and in Ts65Dn mice.Hippocampus. 2007;17(8):665-78. doi: 10.1002/hipo.20308. Hippocampus. 2007. PMID: 17546680
-
Abnormal development of the inferior temporal region in fetuses with Down syndrome.Brain Pathol. 2018 Nov;28(6):986-998. doi: 10.1111/bpa.12605. Epub 2018 Jul 5. Brain Pathol. 2018. PMID: 29509279 Free PMC article.
-
Neurogenesis impairment: An early developmental defect in Down syndrome.Free Radic Biol Med. 2018 Jan;114:15-32. doi: 10.1016/j.freeradbiomed.2017.07.026. Epub 2017 Jul 27. Free Radic Biol Med. 2018. PMID: 28756311 Review.
-
Developmental instability of the cerebellum and its relevance to Down syndrome.J Neural Transm Suppl. 2001;(61):11-34. doi: 10.1007/978-3-7091-6262-0_2. J Neural Transm Suppl. 2001. PMID: 11771737 Review.
Cited by
-
Longitudinal neuroanatomical and behavioral analyses show phenotypic drift and variability in the Ts65Dn mouse model of Down syndrome.Dis Model Mech. 2020 Sep 25;13(9):dmm046243. doi: 10.1242/dmm.046243. Dis Model Mech. 2020. PMID: 32817053 Free PMC article.
-
Sexually dimorphic DYRK1A overexpression on postnatal day 15 in the Ts65Dn mouse model of Down syndrome: Effects of pharmacological targeting on behavioral phenotypes.Pharmacol Biochem Behav. 2022 Jun;217:173404. doi: 10.1016/j.pbb.2022.173404. Epub 2022 May 14. Pharmacol Biochem Behav. 2022. PMID: 35576991 Free PMC article.
-
Integrated Quantitative Transcriptome Maps of Human Trisomy 21 Tissues and Cells.Front Genet. 2018 Apr 24;9:125. doi: 10.3389/fgene.2018.00125. eCollection 2018. Front Genet. 2018. PMID: 29740474 Free PMC article.
-
Building an adaptive brain across development: targets for neurorehabilitation must begin in infancy.Front Behav Neurosci. 2015 Sep 11;9:232. doi: 10.3389/fnbeh.2015.00232. eCollection 2015. Front Behav Neurosci. 2015. PMID: 26441566 Free PMC article. Review.
-
Metabolic Diseases and Down Syndrome: How Are They Linked Together?Biomedicines. 2021 Feb 22;9(2):221. doi: 10.3390/biomedicines9020221. Biomedicines. 2021. PMID: 33671490 Free PMC article. Review.
References
-
- Abraham H, Tornoczky T, Kosztolanyi G, Seress L (2001) Cell formation in the cortical layers of the developing human cerebellum. Int J Dev Neurosci 19:53–62. - PubMed
-
- Aylward EH, Habbak R, Warren AC, Pulsifer MB, Barta PE, Jerram M, Pearlson GD (1997) Cerebellar volume in adults with Down syndrome. Arch Neurol 54:209–212. - PubMed
-
- Aylward EH, Li Q, Honeycutt NA, Warren AC, Pulsifer MB, Barta PE et al (1999) MRI volumes of the hippocampus and amygdala in adults with Down's syndrome with and without dementia. Am J Psychiatry 156:564–568. - PubMed
-
- Baxter LL, Moran TH, Richtsmeier JT, Troncoso J, Reeves RH (2000) Discovery and genetic localization of Down syndrome cerebellar phenotypes using the Ts65Dn mouse. Hum Mol Genet 9:195–202. - PubMed
Publication types
MeSH terms
LinkOut - more resources
Full Text Sources
Other Literature Sources
Medical
Research Materials
