. 2010 Nov 4;68(3):387-400.
doi: 10.1016/j.neuron.2010.09.015.

Cortical preparatory activity: representation of movement or first cog in a dynamical machine?

Affiliations

Cortical preparatory activity: representation of movement or first cog in a dynamical machine?

Mark M Churchland et al. Neuron. .

Abstract

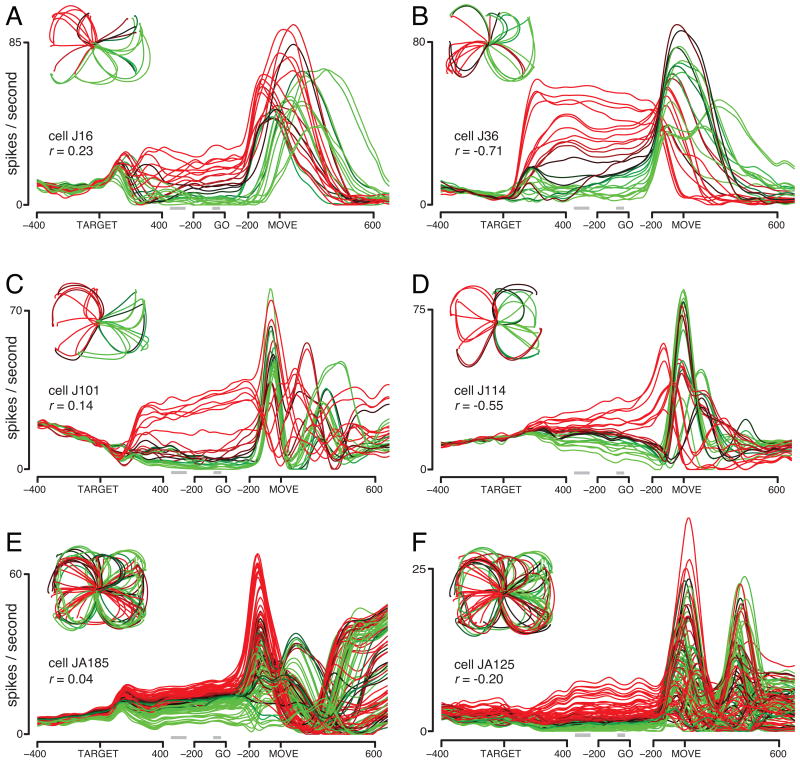
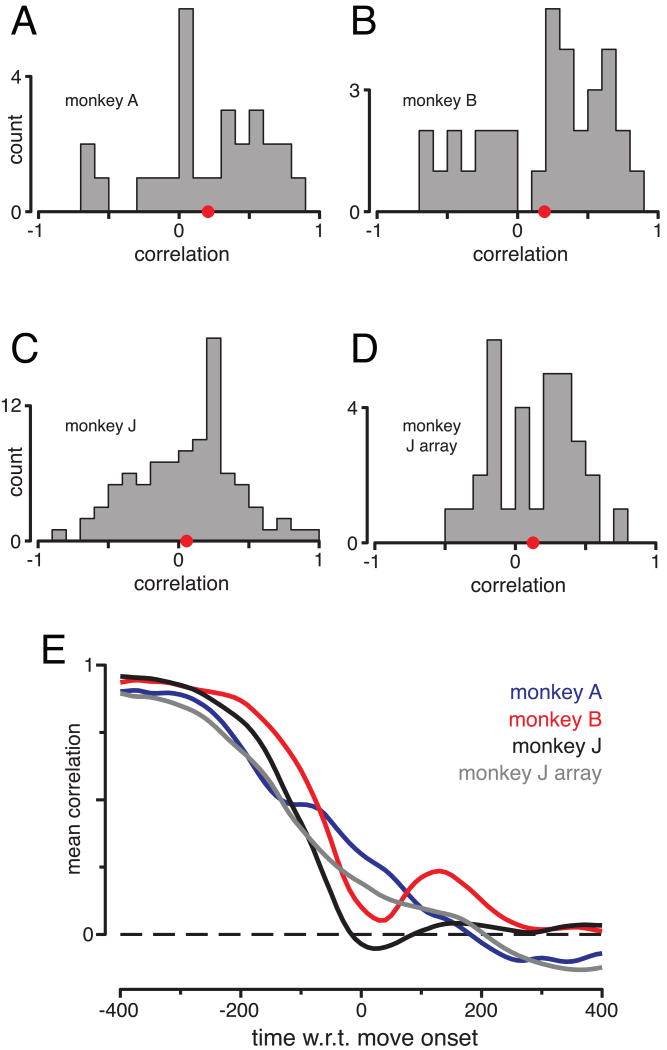
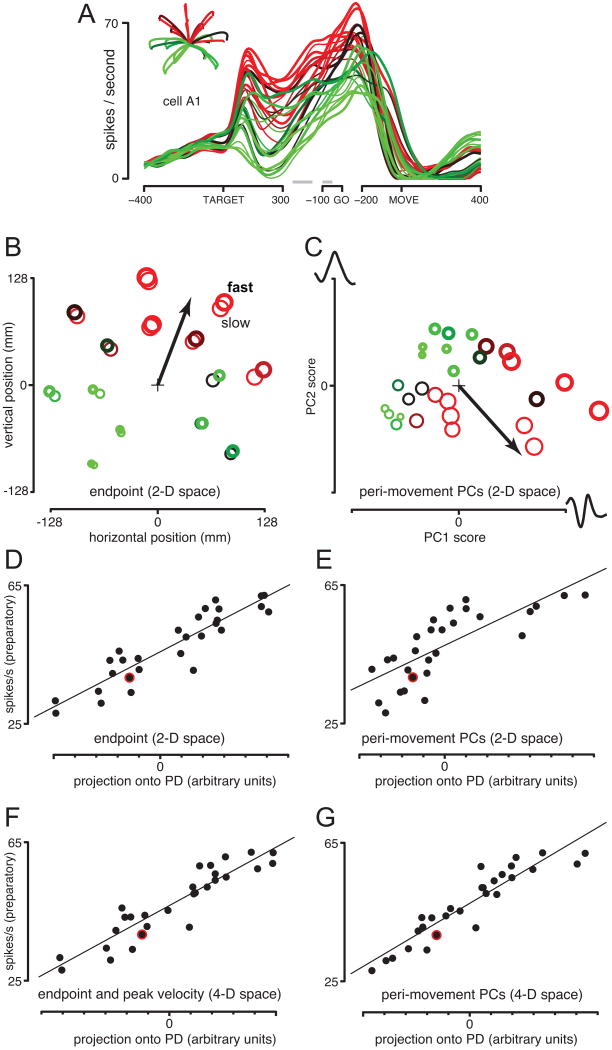
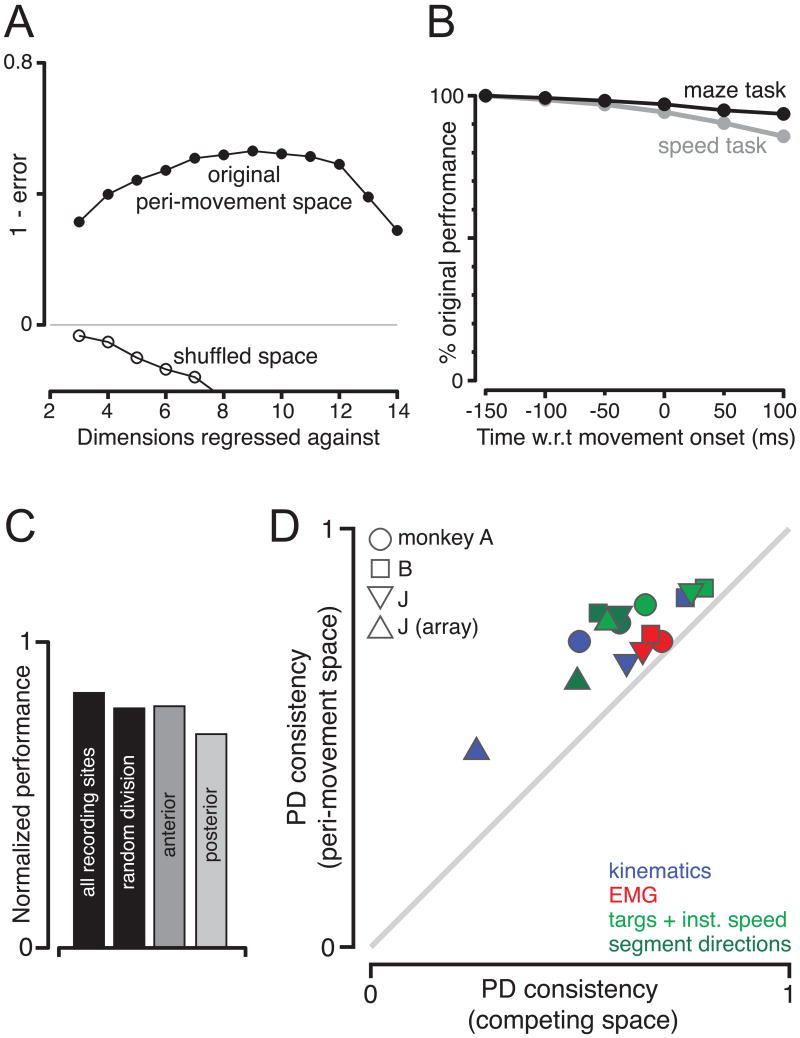
The motor cortices are active during both movement and movement preparation. A common assumption is that preparatory activity constitutes a subthreshold form of movement activity: a neuron active during rightward movements becomes modestly active during preparation of a rightward movement. We asked whether this pattern of activity is, in fact, observed. We found that it was not: at the level of a single neuron, preparatory tuning was weakly correlated with movement-period tuning. Yet, somewhat paradoxically, preparatory tuning could be captured by a preferred direction in an abstract "space" that described the population-level pattern of movement activity. In fact, this relationship accounted for preparatory responses better than did traditional tuning models. These results are expected if preparatory activity provides the initial state of a dynamical system whose evolution produces movement activity. Our results thus suggest that preparatory activity may not represent specific factors, and may instead play a more mechanistic role.


Figures

Figure 1
Figure 1
Illustration of behavior. A. Reaches were from a central spot to a target. An example trajectory is shown. B. Task timeline. Upon appearing (T) the target jittered slightly. Cessation of jitter provided the go cue (G). M indicates movement onset. C. Behavior: speed task. Velocity in the target direction for the 7 directions, 2 distances and 2 instructed speeds. D. Behavior: maze task. For this example condition the reach had to curve over a virtual barrier. In other conditions, reaches avoided different arrangements of barriers, or were straight with no barriers. Reaches lasted ∼200 to ∼600 ms (depending on distance/curvature).
Figure 2
Figure 2
An idealized schematic of neural activity (A) and responses of example neurons (B-E, instructed speed task). A. Traces are colored red (preferred) and green (non-preferred). In this conception, preparatory activity is present during the delay period, rises to a threshold following the go cue, and produces a burst of peri-movement activity. B. Firing rate versus time for an example neuron whose responses resemble the schematic in A. Responses are shown for all 7 reach directions for the fast instructed speed and shorter distance. Traces are shaded from red to green based on the firing rate 50 ms before the go cue. Data were averaged separately locked to target onset, the go cue, and movement onset. To aid viewing, data have been interpolated across the gaps between these three epochs. See Supplemental Figure 4 for a description of the smoothing used to produce these PSTHs. Inset plots mean hand trajectory using the same color-coding. C-E. Similar plots for three more example neurons. Data have been down-selected to a single distance and instructed speed (far/fast for these panels). These three neurons were selected to illustrate the fact that preparatory and peri-movement tuning were typically different, even in the simplest paradigm: straight reaches at one distance / instructed-speed.
Figure 3
Figure 3
Responses of six example neurons (maze task, similar format to Fig. 2). Responses are shown for all conditions, including straight and curved reaches. Different conditions, involving different maze configurations, sometimes evoked similar reach trajectories (although not necessarily with similar velocity profiles). The same 108 conditions were used for the J and J-array datasets. For the former a given neuron was recorded using one of four 27-condition subsets. The insets in A-D thus show different reach patterns, corresponding to different subsets. In addition to temporal filtering, additional de-noising was accomplished via the method in Supplemental Figure 4. This method removes uncorrelated noise, and thus cannot eliminate noise in the firing rate that is accidentally similar across conditions (e.g., during the delay period in F).
Figure 4
Figure 4
Correlation between preparatory and peri-movement tuning. A-D. Distribution of correlations (measured once per neuron) for the four datasets. Analysis was restricted to neurons robustly tuned during both epochs (Methods). Red dot indicates the distribution mean. E. Average correlation as a function of when peri-movement activity was assessed. Peri-movement activity was measured at a single time-point, after smoothing with a 20 ms Gaussian kernel. Correlations are initially high, as preparatory tuning is being correlated with itself.
Figure 5
Figure 5
Example PDs in a space based on movement endpoints (left column) and the ‘peri-movement space’ (right column). A. Firing rate as a function of time for an example neuron. All 28 conditions are shown. B. Mean reach endpoint for each condition. Red-to-green shading and symbol size indicate preparatory firing rate for that condition. Symbol thickness indicates instructed speed. The PD (arrow) points towards conditions with the greatest preparatory activity. C. The same 28 conditions located in the peri-movement space. Each axis corresponds to a population-level pattern of peri-movement activity (a PC). The subsection of this pattern coming from a single neuron (A34, chosen arbitrarily) is plotted at the end of each axis. Thus, the rightmost red symbol corresponds to a condition where the ‘PC1 pattern’ was strongly present. D. Firing rate versus each condition's projection onto the PD, using the endpoint space from B. E. Similar to D, but for the peri-movement space. F. Same as D but for a 4-D space defined by reach endpoint and peak velocity. G. Same as E but for a 4-D peri-movement space.
Figure 6
Figure 6
Ability of the PD to account for preparatory tuning. A-D. Performance of the PD for the four datasets. For PCA-based spaces (peri-movement, kinematic, EMG) performance is plotted over a range of tested dimensionalities. ‘Task’ spaces (green) are plotted versus their respective dimensionalities. Gray line is an estimate of the upper-limit on performance given measurement error (Methods). E. Summary of performance, spanning datasets from monkeys A, B and J. We combined only across spaces defined for all datasets (e.g., ‘targs + inst. spd.’ was not included, but ‘endpoints + max. spd.’ was included). Subpanels plot performance for spaces of the indicated dimensionality or less. Bars plot SEs. Asterisks indicate performance significantly worse (p<0.001) than the best space.
Figure 7
Figure 7
Further controls and analyses. A. Performance of the ‘shuffled’ peri-movement spaces, averaged over all the datasets. During shuffling, the firing rate for each neuron/condition, was either left intact (50% probability) or the peri-movement pattern was inverted. This was done by preserving activity up 150 ms before movement onset, and reflecting (vertically) all subsequent activity around the firing rate at that time. B. Performance (averaged across neurons) versus the start of the peri-movement interval. Performance was measured using the best dimensionality for that dataset/start-time. C. Performance of the peri-movement space for subsets of the original data. Performance was computed for a six-dimensional space, normalized, and averaged across datasets. Left-most bar: performance for all data. Gray bars: performance for sites with AP locations >= the median (anterior), <= to the median (posterior). Second black bar: performance when data were randomly subdivided. D. PD consistency for the peri-movement space versus that for a variety of other spaces. Kinematic and EMG spaces were chosen because they had performed the best overall (after the peri-movement space) in the analysis in Fig. 6. ‘Targs. + inst. speed’ and ‘segment directions’ spaces were chosen because they performed well for the speed and maze tasks respectively. ‘Targs. + inst. speed’ was undefined for the maze task; the similar ‘endpoints + max. spd.’ space was analyzed instead.
Figure 8
Figure 8
Illustration of the behavior of a simple linear dynamical system: a harmonic oscillator. A. Changes in the initial state produce a linear scaling of the subsequent activity pattern. In this case, the larger the initial state of unit 1, the greater the amplitude of the oscillation. B. State space containing 25 randomly chosen initial states (25 ‘conditions’). Symbol size/color indicates the initial firing rate of unit 1. For the simulations below, activity evolved counterclockwise from the initial state: x(t+1) = Wx(t), where x is the 2-dimensional vector of unit activities, and the matrix W = [1 - 2π/360; 2π/360 1]. Thus, the state rotates one degree with each time-step. C. Activity of unit 1 versus time for the initial states shown in B. The initial state was at first held constant (as if W were the identity matrix) to emulate preparatory activity. The dynamics were then released to produce sinusoidal ‘peri-movement’ activity. Asterisks indicate the same two conditions as in B. D. The pattern of initial states (the ‘preparatory tuning’) from C is captured by a PD in peri-movement space. Analysis/format are the same as for figure 5C. Traces on each axis plot the time-evolving pattern corresponding to that PC (black and blue traces for units one and two). The pattern at the end of the arrow is the weighted sum of the two PCs, with weights corresponding to the PD.

References

    1. Bastian A, Riehle A, Erlhagen W, Schoner G. Prior information preshapes the population representation of movement direction in motor cortex. Neuroreport. 1998;9:315–319. - PubMed
    1. Bastian A, Schoner G, Riehle A. Preshaping and continuous evolution of motor cortical representations during movement preparation. Eur J Neurosci. 2003;18:2047–2058. - PubMed
    1. Batista AP, Santhanam G, Yu BM, Ryu SI, Afshar A, Shenoy KV. Reference frames for reach planning in macaque dorsal premotor cortex. J Neurophysiol. 2007;98:966–983. - PubMed
    1. Caminiti R, Johnson PB, Urbano A. Making arm movements within different parts of space: dynamic aspects in the primate motor cortex. J Neurosci. 1990;10:2039–2058. - PMC - PubMed
    1. Churchland MM, Afshar A, Shenoy KV. A central source of movement variability. Neuron. 2006a;52:1085–1096. - PMC - PubMed

Publication types

LinkOut - more resources