. 2010 Nov 4;68(3):409-27.
doi: 10.1016/j.neuron.2010.09.043.

Pericytes control key neurovascular functions and neuronal phenotype in the adult brain and during brain aging

Affiliations

Pericytes control key neurovascular functions and neuronal phenotype in the adult brain and during brain aging

Robert D Bell et al. Neuron. .

Erratum in

Abstract

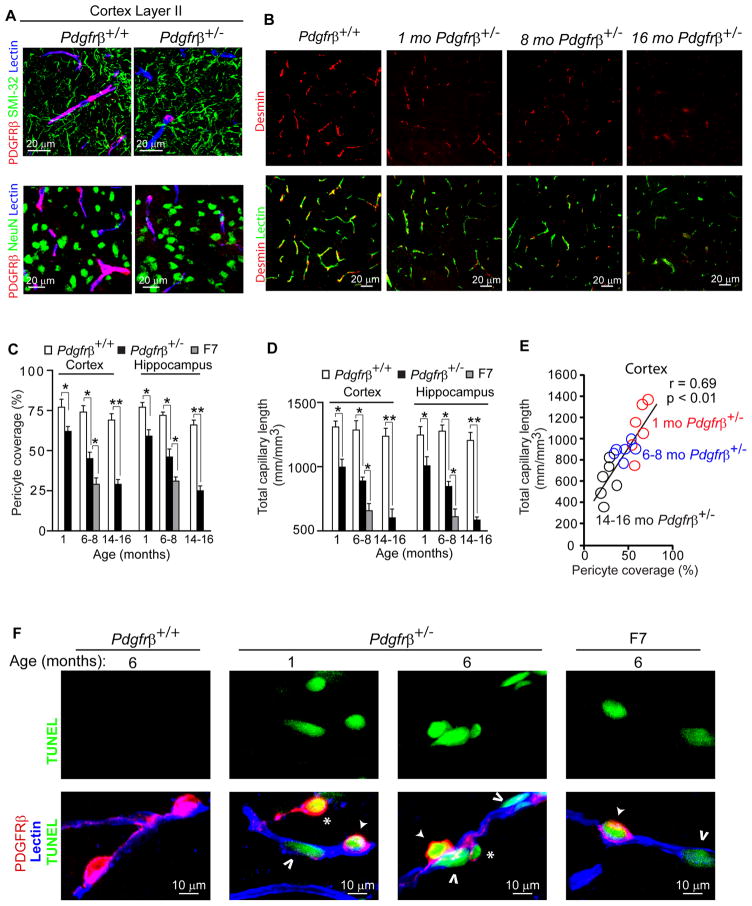
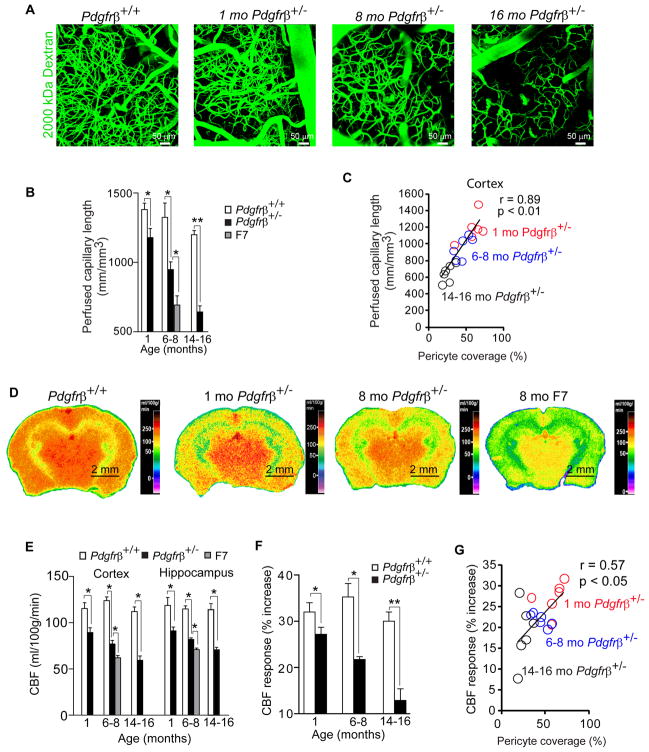
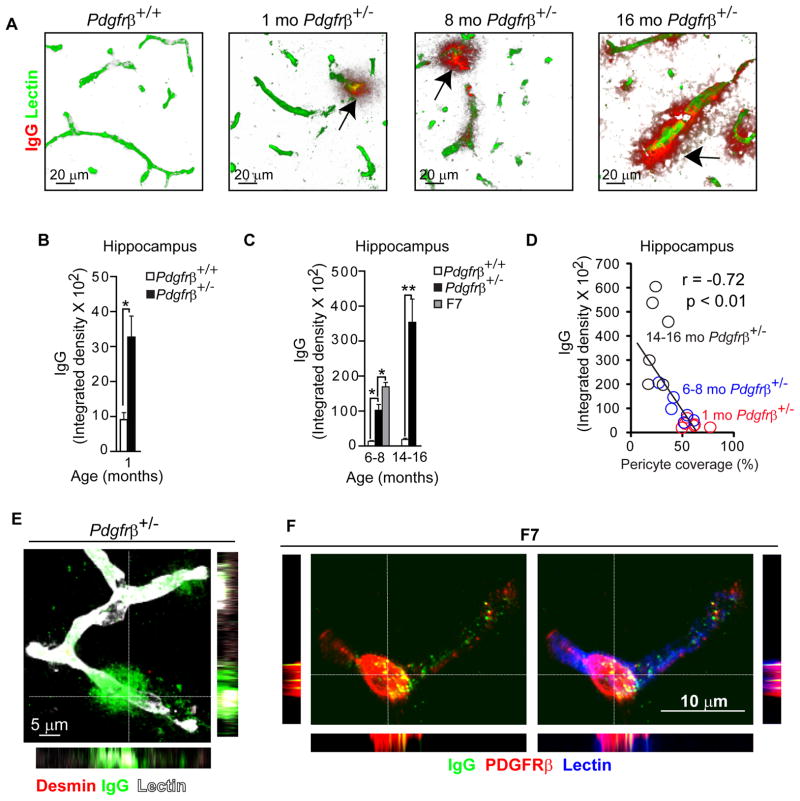
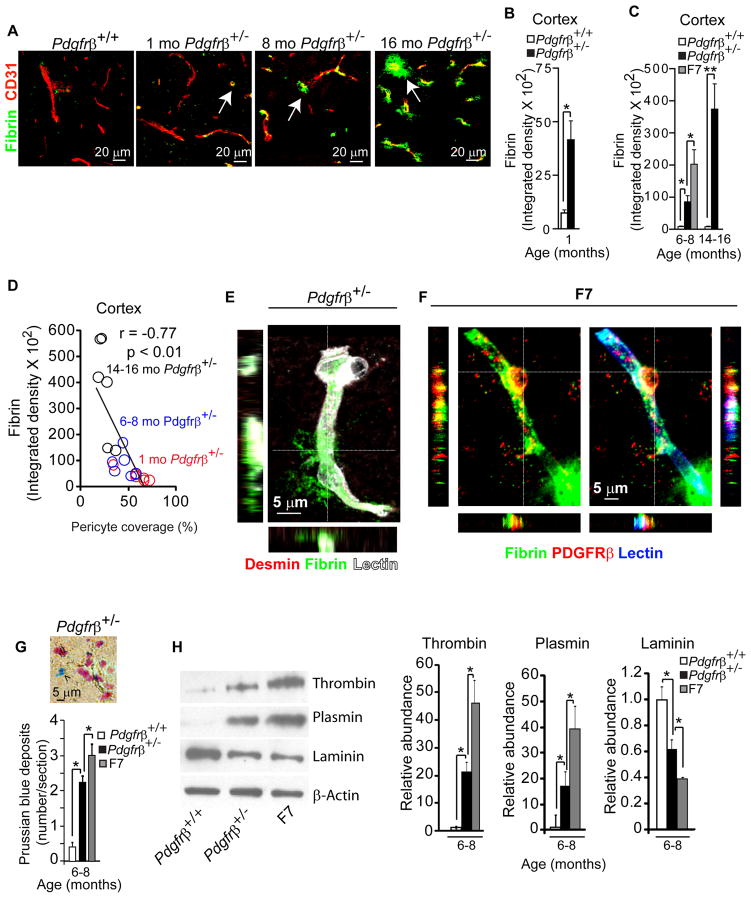
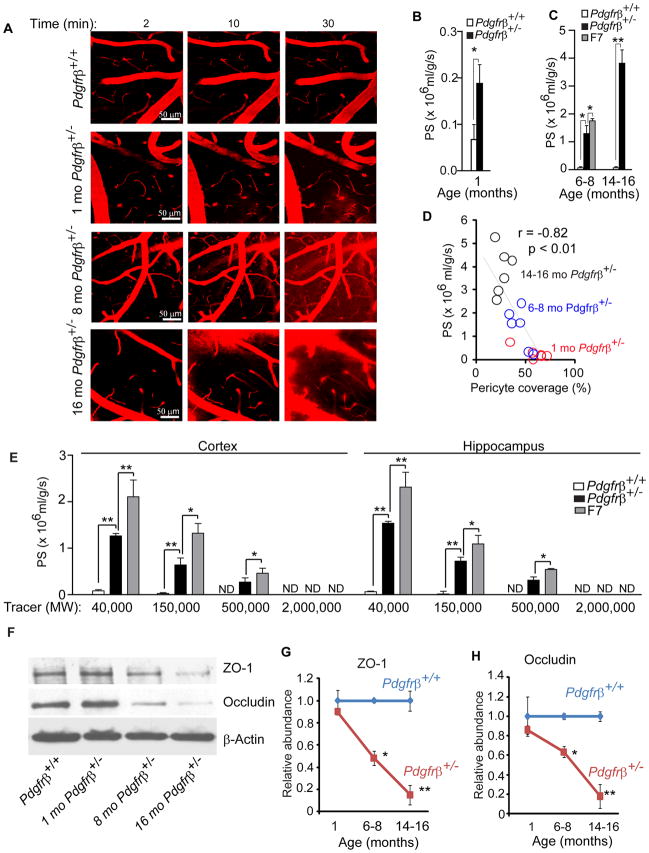
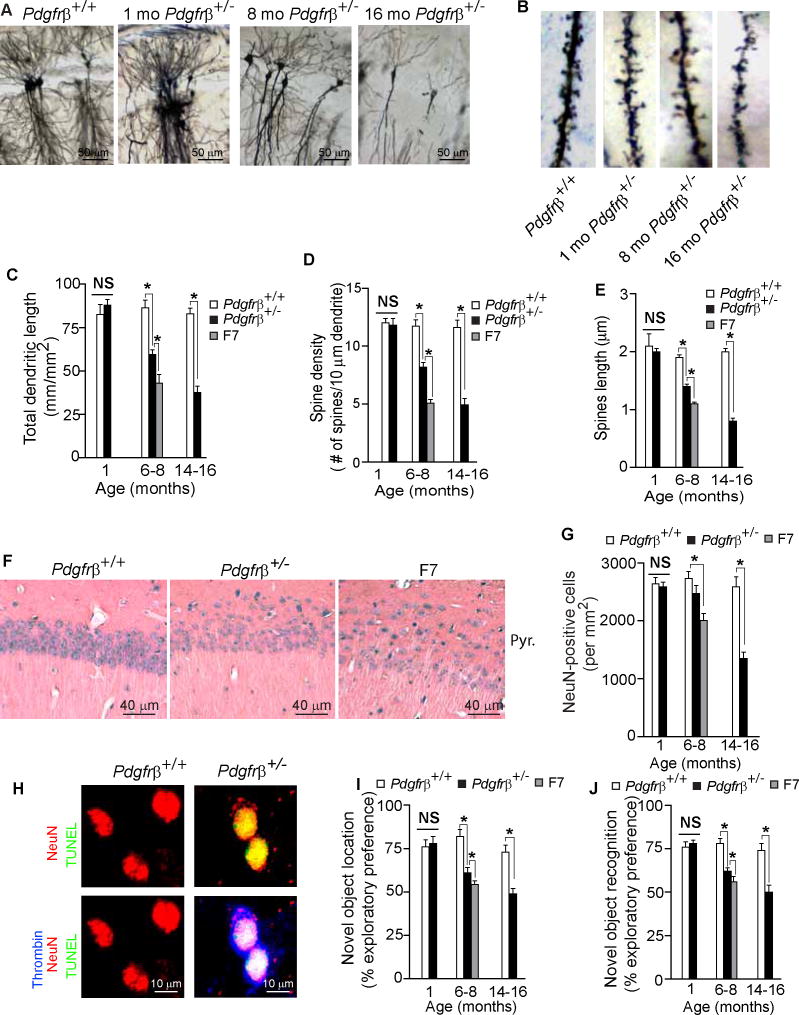
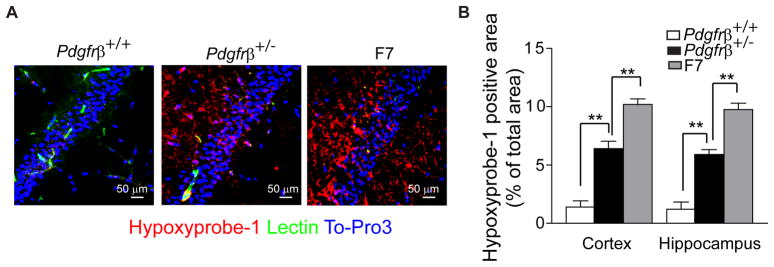
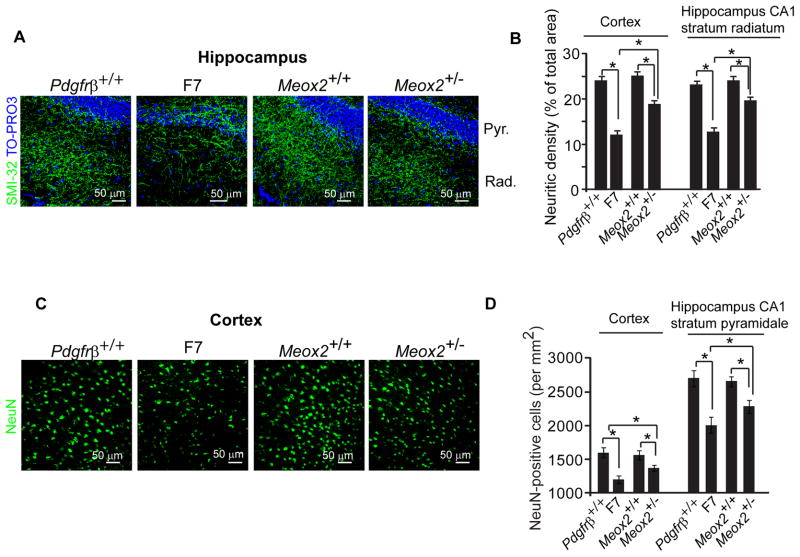
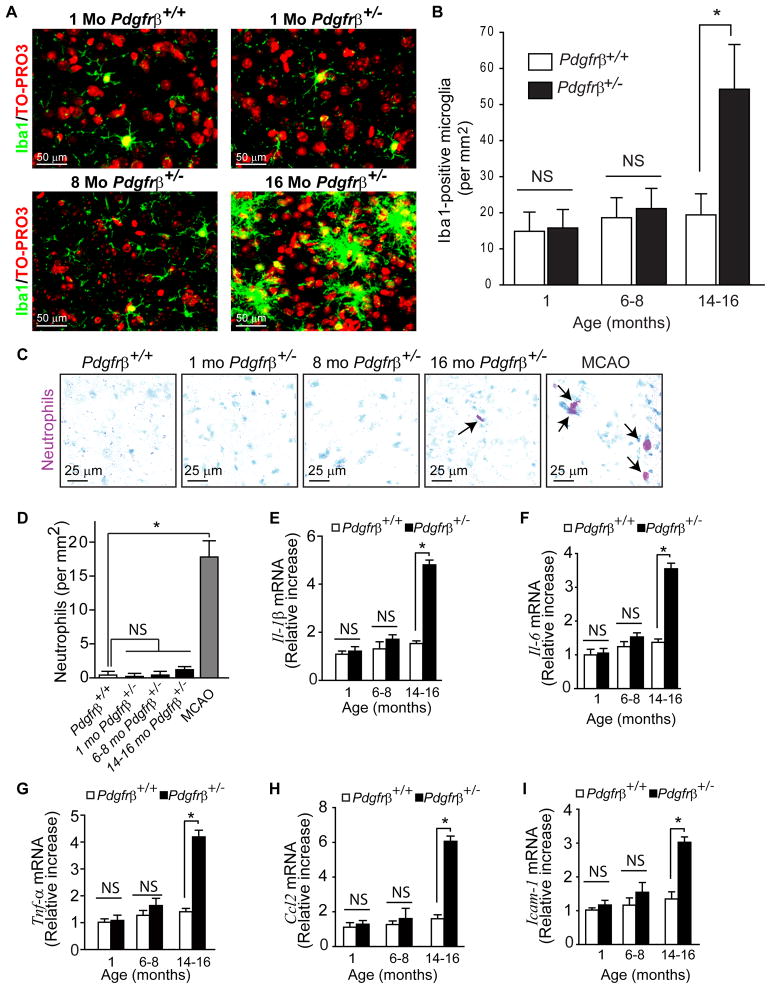
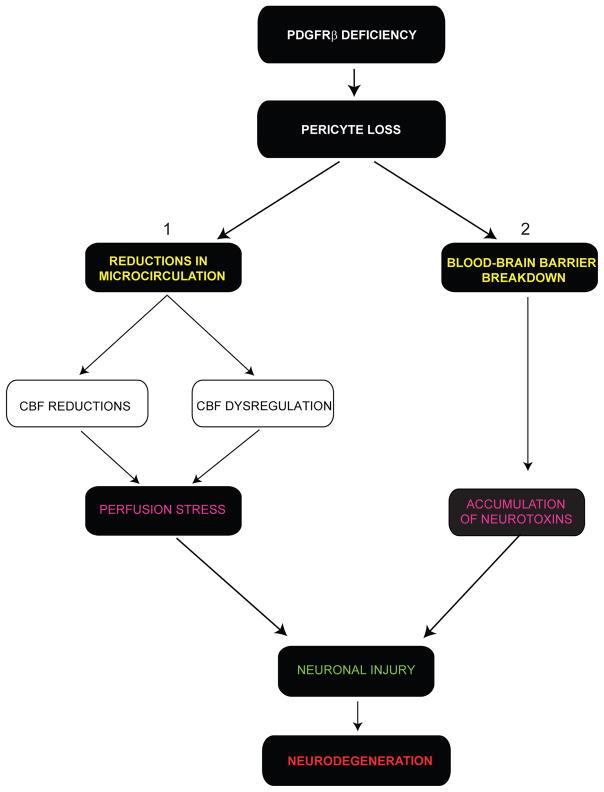
Pericytes play a key role in the development of cerebral microcirculation. The exact role of pericytes in the neurovascular unit in the adult brain and during brain aging remains, however, elusive. Using adult viable pericyte-deficient mice, we show that pericyte loss leads to brain vascular damage by two parallel pathways: (1) reduction in brain microcirculation causing diminished brain capillary perfusion, cerebral blood flow, and cerebral blood flow responses to brain activation that ultimately mediates chronic perfusion stress and hypoxia, and (2) blood-brain barrier breakdown associated with brain accumulation of serum proteins and several vasculotoxic and/or neurotoxic macromolecules ultimately leading to secondary neuronal degenerative changes. We show that age-dependent vascular damage in pericyte-deficient mice precedes neuronal degenerative changes, learning and memory impairment, and the neuroinflammatory response. Thus, pericytes control key neurovascular functions that are necessary for proper neuronal structure and function, and pericyte loss results in a progressive age-dependent vascular-mediated neurodegeneration.


Figures

Figure 1
Figure 1. Age-Dependent Pericyte Loss and Brain Microvascular Regression in Mice with Pericyte-Specific PDGFRβ Deficient Signaling
(A) Confocal microscopy analysis of PDGFRβ on perivascular pericytes (red), SMI-32 neurofilament marker (green, top panels), neuronal-specific marker NeuN (green, bottom panels) and lectin-positive brain capillaries (blue) in the layer II parietal cortex of a 2 month old Pdgfrβ+/+ and Pdgfrβ+/− mice showing no colocalization of PDGFRβ with neurons. (B) Representative confocal microscopy analysis of desmin immunodetection showing pericyte coverage (red) of lectin-positive brain capillaries (green) in the parietal cortex of an 8 month old Pdgfrβ+/+ mouse and 1, 8 and 16 month old Pdgfrβ+/− mice. (C) Age-dependent loss of pericyte coverage in the cortex and hippocampus of 1, 6–8, and 14–16 month old Pdgfrβ+/− mice (black bars) and in 6–8 month old F7 mice (gray bars) compared to age-matched Pdgfrβ+/+ controls (white bars). Pericyte coverage was determined as a percentage (%) of desmin-positive pericyte surface area covering lectin-positive capillary surface area that was arbitrarily taken as 100%. Total of 36 and 24 randomly chosen fields (420 × 420 μm) from 6 non-adjacent cortical and hippocampal sections, respectively, were analyzed per mouse. Mean ± s.e.m., n=6 mice per group; *p<0.05 or **p<0.01 by one-way ANOVA. (D) Length of lectin-positive capillary profiles in the cortex and hippocampus of 1, 6–8, and 14–16 month old Pdgfrβ+/+ mice (white bars) and Pdgfrβ+/− mice (black bars), and 6–8 month old F7 mice (gray bars). Total of 36 and 24 observations in the cortex and hippocampus from the same fields as in C were analyzed per mouse, respectively. Mean ± s.e.m., n=6 mice per group; *p<0.05 or **p<0.01 by one-way ANOVA. (E) Positive correlation between age-dependent reduction in capillary length and loss of pericyte coverage in the cortex of Pdgfrβ+/− mice. Single data points were from 1(red), 6–8 (blue) and 14–16 (black) month old Pdgfrβ+/− mice (n=18). r = Pearson’s coefficient. (F) Confocal microscopy analysis of TUNEL (green, top panels), PDGFRβ immunodetection on pericytes (red) and lectin-positive capillaries (blue) in the cortex of 6 month old Pdgfrβ+/+, 1 and 6 month old Pdgfrβ+/− mouse and 6 month old F7 mouse. Closed arrow, TUNEL-positive attached pericyte; *, TUNEL-positive detaching pericyte; Open arrow, TUNEL-positive endothelial cell. (See Fig. S1)
Figure 2
Figure 2. Diminished Brain Capillary Perfusion and Changes in Cerebral Blood Flow in Pericyte-Deficient Mice
(A) Perfusion of cortical microvessels studied by in vivo multiphoton microscopy analysis of fluorescein-conjugated mega-dextran (MW=2,000,000; green) in 8 month old Pdgfrβ+/+ mouse, and 1, 8 and 16 month old Pdgfrβ+/− mice. (B) Quantification of perfused capillary length from angiograms obtained as in A. in 1, 6–8, and 14–16 month old Pdgfrβ+/+ mice (white bars) and Pdgfrβ+/− mice (black bars), and in 6–8 month old F7 mice (gray bars). Two to three angiograms were analyzed per mouse. (C) Positive correlation between age-dependent reductions of brain capillary perfusion and desmin-positive pericyte coverage of cortical capillaries in Pdgfrβ+/− mice. Single data points were from 1 (red), 6–8 (blue) and 14–16 (black) month old Pdgfrβ+/− mice (n=18). r = Pearson’s coefficient. (D) 14C-iodoantipyrine (IAP) autoradiography of the cerebral blood flow (CBF) in an 8 month old Pdgfrβ+/+ mouse, 1 and 8 month old Pdgfrβ+/− mice and an 8 month old F7 mouse. (E) Local CBF determined using 14C-IAP autoradiography as in D. in 1, 6–8, and 14–16 month old Pdgfrβ+/+ mice (white bars) and Pdgfrβ+/− mice (black bars), and in 6–8 month old F7 mice (gray bars). (See Table S1). (F) CBF responses to whisker-barrel cortex vibrissal stimulus (% increase from basal values) in 1, 6–8 and 14–16 month old Pdgfrβ+/+ mice (white bars) and Pdgfrβ+/− mice (black bars). (G) Positive correlation between diminished CBF responses to a stimulus and an age-dependent loss of pericyte coverage of cortical capillaries in Pdgfrβ+/− mice. Single data points were from 1 (red), 6–8 (blue) and 14–16 (black) month old Pdgfrβ+/− mice (n=18). r =Pearson’s coefficient. In B, C, E and F, mean ± s.e.m., n=6 mice per group; *p<0.05 or **p<0.01 by one-way ANOVA.
Figure 3
Figure 3. Age-Dependent Blood-Brain Barrier Disruption to Plasma Proteins in Pericyte-Deficient Mice
(A) Confocal microscopy analysis of plasma-derived IgG (red) and fluorescein-conjugated lectin-positive microvessels (green) in the hippocampus of an 8 month old Pdgfrβ+/+ and in 1, 8 and 16 month old Pdgfrβ+/− mice. Arrows, extravascular IgG deposits. (B–C) Quantification of extravascular IgG deposits in the hippocampus of 1 month old Pdgfrβ+/− mice (black bar) and Pdgfrβ+/+ controls (white bar) (B), and in 6–8 and 14–16 month old Pdgfrβ+/− mice (black bars), and Pdgfrβ+/+ controls (white bars) and 6–8 month old F7 mice (gray bar) (C). In B and C, 24 randomly chosen fields (420 × 420 μm) within the hippocampus were analyzed from 6 non-adjacent sections per mouse. Values are mean ± s.e.m., n=6 mice per group; *p<0.05 or **p<0.01 by one-way ANOVA. (See Fig. S2). (D) Negative correlation between an age-dependent IgG brain accumulation and loss of pericyte capillary coverage in the hippocampus of Pdgfrβ+/− mice. Single data points were from 1 (red), 6–8 (blue) and 14–16 (black) month old Pdgfrβ+/− mice (n=18). r = Pearson’s coefficient. (E) Confocal microscopy imaging of IgG deposits (green) around lectin-positive capillaries (white) lacking pericyte coverage (red; negative desmin staining) in an 8 month old Pdgfrβ+/− mouse. Orthogonal views suggest that microvessels lacking pericyte coverage have significant perivascular IgG accumulation. (F) Confocal microscopy analysis of IgG (green) and a pericyte marker PDGFRβ (red) on lectin-positive (blue) pericyte-covered capillary in an 8 month old F7 mutant mouse. Orthogonal views show IgG accumulation in a PDGFRβ-positive pericyte in a F7 mouse.
Figure 4
Figure 4. Pathologic Accumulations in Brains of Pericyte-Deficient Mice
(A) Confocal microscopy analysis of fibrin (green) and CD31-positive microvessels (red) in the cortex of an 8 month old Pdgfrβ+/+ and 1, 8 and 16 month old Pdgfrβ+/− mice. Arrows, extravascular fibrin deposits. (B–C) Quantification of fibrin extravascular deposits in the cortex of 1 month old Pdgfrβ+/+ (white bar) and Pdgfrβ+/− mice (black bar) (B), and 6–8 and 14–16 month old Pdgfrβ+/+ (white bars) and Pdgfrβ+/− mice (black bar), and 6–8 month old F7 mice (gray bar) (C). In BC, 36 randomly chosen fields (420 × 420 μm) in the cortex were analyzed from 6 non-adjacent sections per mouse. Values are mean ± s.e.m., n=6 mice per group; *p<0.05 or **p<0.01 by one-way ANOVA. (See Fig. S2). (D) Negative correlation between an age-dependent fibrin extravascular accumulation and loss of pericyte coverage in the cortex of Pdgfrβ+/− mice. Single data points derived from 1 (red), 6–8 (blue) and 14–16 (black) month old Pdgfrβ+/− mice (n=18). r = Pearson’s coefficient. (E) Confocal microscopy imaging of fibrin deposits (green) around lectin-positive capillary (white) lacking desmin-positive (red) pericyte coverage in an 8 month old Pdgfrβ+/− mouse. The orthogonal views show a significant perivascular fibrin accumulation. (F) Confocal microscopy imaging of fibrin (green) and a pericyte marker PDGFRβ (red) covering a lectin-positive capillary (blue) in an 8 month old F7 mutant mouse. Orthogonal views show fibrin accumulation in a PDGFRβ-positive pericyte in a F7 mouse. (G) Quantification of Prussian blue-positive hemosiderin deposits in sagittal brain sections of cortex plus hippocampus of 8 month old Pdgfrβ+/− and F7 mice compared to age-matched Pdgfrβ+/+ controls. Inset, a hemosiderin deposit in the cortex of an 8 month old Pdgfrβ+/− mouse. A total of 6 non-adjacent sections were analyzed per mouse. (H) Immunoblotting of thrombin, plasmin and laminin in capillary-depleted brain tissue of 8 month old Pdgfrβ+/+, Pdgfrβ+/− and F7 mice. β-actin was used as a loading control. Graphs show quantification of relative protein abundance using densitometry analysis. Mean ± s.e.m., n=6 animals per group; *p<0.05 or **p<0.01 by one-way ANOVA.
Figure 5
Figure 5. Blood-Brain Barrier Breakdown to Exogenous Dextran in Pericyte-Deficient Mice
(A) In vivo time-lapse multiphoton imaging of tetramethylrhodamine (TMR) dextran (MW = 40,000; red) leakage from cortical vessels (layer II and III, approximately 100 μm from the cortical surface) in an 8 month old Pdgfrβ+/+ mouse, and 1, 8 and 16 month old Pdgfrβ+/− mice within 30 min of TMR-dextran intravenous administration. (B–C) The cerebrovascular permeability surface area product (PS) for TMR- dextran (40,000 Da) determined by multiphoton imaging as in A. in 1 month old Pdgfrβ+/− mice (black bar) and control Pdgfrβ+/+ (white bar) mice (B), and 6–8 and 14–16 month old Pdgfrβ+/− (black bar) and control Pdgfrβ+/+ (white bars) mice, and 6–8 month old F7 mice (gray bar) (C). (D) Negative correlation between the PS product for TMR-dextran and age-dependent loss of pericyte coverage of cortical capillaries in Pdgfrβ+/− mice. Single data points derived from 1 (red), 6–8 (blue) and 14–16 (black) month old Pdgfrβ+/− mice (n=18). r = Pearson’s coefficient. (E) The blood-brain barrier permeability PS product for TMR-dextran (40,000 Da), Cy-3-IgG (150,000 Da) FITC-Dextran (MW=500,000 Da) and fluorescein-conjugated mega-Dextran (MW=2,000,000 Da) in 6–8 month old Pdgfrβ+/+ (white bar), Pdgfrβ+/− (black bar) and F7 (gray bar) mice determined by a non-invasive fluorometric tissue analysis not requiring the cranial window surgical procedure. Mean ± s.e.m., n=4–6 animals per group. *p<0.05 or ** p<0.01 by one-way ANOVA. ND. Non-detectable. (F) Immunoblotting of ZO-1 and occludin in isolated cortical and hippocampal capillaries from a 16 month old Pdgfrβ+/+ control mouse and 1, 8 and 16 month old Pdgfrβ+/− mice. (G–H) Quantification of ZO-1 (G) and occludin (H) relative abundance by densitometry analysis of immunoblots in 1, 8 and 16 month old Pdgfrβ+/+ and Pdgfrβ+/− mice showing a progressive decrease in the tight junction proteins in the aging pericyte-deficient mice. β-actin was used as a loading control. In B, C, G and H, mean ± s.e.m., n=6 animals per group. *p<0.05 or ** p<0.01 by one-way ANOVA. (See Fig. S3–S5).
Figure 6
Figure 6. Age-Dependent Neurodegeneration and Impairments in Memory and Learning in Pericyte-Deficient Mice
(A–B) Low magnification bright-field microscopy analysis of Golgi-Cox staining of neurons (A) and high magnification bright-field microscopy images of dendritic spine density (B) in the CA1 region of the hippocampus of an 8 month old Pdgfrβ+/+ control and 1, 8 and 16 month old Pdgfrβ+/− mice. (C–E) Dendritic length (C), dendritic spine density (D) and spine length (E) of Golgi-Cox stained neurons in the CA1 region of the hippocampus in 1, 6–8, and 14–16 month old Pdgfrβ+/− mice (black bars) and control Pdgfrβ+/+ (white bars) mice, and 6–8 month old F7 mice (gray bars). Total of 30 fields (500 × 375 μm) from 3 adjacent 100 μm thick sections were analyzed per mouse for dendritic length measurements. Total of 100 randomly selected dendrites from 3 adjacent 100 μm thick sections were analyzed per mouse for dendritic spine density measurements and for spine length quantification. (F) Bright-field microscopy analysis of hemotoxylin and eosin staining of stratum pyramidale in the CA1 hippocampal region of 6 month old Pdgfrβ+/+, Pdgfrβ+/− and F7 mice. (G) Quantification of NeuN-positive neurons in the stratum pyramidale of the CA1 hippocampal subfield in 1, 6–8, and 14–16 month old Pdgfrβ+/− (black bars) and control Pdgfrβ+/+ (white bars) mice, and 6–8 month old F7 mice (gray bar). Total of 24 randomly chosen CA1 fields (420 × 420 μm) in the hippocampus were analyzed from 6 non-adjacent sections per mouse. (H) Confocal microscopy analysis of TUNEL (green), NeuN-positive neuronal nuclei (red) and thrombin (blue) in the cortex of an 8 month old Pdgfrβ+/− and control Pdgfrβ+/+ mouse. (I–J) Novel object location (I) and novel object recognition (J) exploratory preference in 1, 6–8, and 14–16 month old Pdgfrβ+/− mice (black bars) and age-matched Pdgfrβ+/+ control mice (white bars) and in 6–8 month old F7 mice (gray bars). (See Fig. S6). In C–E, G and I–J, mean ± s.e.m., n = 6–10 mice per group; *p<0.05 by one-way ANOVA. NS, non-significant.
Figure 7
Figure 7. Hypoxic Brain Tissue Changes in Pericyte-Deficient Mice
(A) Confocal analysis of hypoxyprobe-1 (pimonidazole)-positive hypoxic (O2 <10 mm Hg) tissue in the hippocampus of 8 month old Pdgfrβ+/+, Pdgfrβ+/− and F7 mice. (B) Quantification of hypoxyprobe-1-positive area expressed as a percentage of total tissue area in the cortex and hippocampus of 6–8 month old Pdgfrβ+/+, Pdgfrβ+/− and F7 mice. A total of 36 and 24 randomly chosen fields (420 × 420 μm) from 6 non-adjacent cortical and hippocampal sections, respectively, were analyzed per mouse. Mean ± s.e.m., n=6 mice per group; *p<0.05 or **p<0.01 by one-way ANOVA. (See Fig. S7).
Figure 8
Figure 8. Neurodegenerative Changes in Meox2+/− and F7 Mice
(A) Confocal microscopy analysis of SMI-32 immunodetection of neurites (green) and Topro3 nuclear staining (blue) in the hippocampus of 8 month old Pdgfrβ+/+ and F7, and Meox2+/+ and Meox2+/− mice. Pyr., Stratum Pyramidale and Rad., Stratum Radiatum. (B) Quantification of SMI-32 positive neurite density in the cortex and hippocampus of 8 month old Pdgfrβ+/+ and F7, and Meox2+/+ and Meox2+/− mice. (C) Confocal microscopy analysis of NeuN-positive neurons (green) in the cortex in 8 month old Pdgfrβ+/+ and F7, and Meox2+/+ and Meox2+/− mice. (D) Quantification of NeuN-positive neurons in the cortex and hippocampus CA1 stratum pyramidale of 8 month old Pdgfrβ+/+ and F7 mice, and Meox2+/+ and Meox2+/− mice. In B and D, a total of 36 and 24 randomly chosen fields (420 × 420 μm) from 6 non-adjacent cortical and hippocampal sections, respectively, were analyzed per mouse. Mean ± s.e.m., n=6 mice per group; *p<0.05 or **p<0.01 by one-way ANOVA
Figure 9
Figure 9. Late Neuroinflammatory Response in Pericyte-Deficient Mice
(A) Confocal microscopy analysis of Iba1-positive microglia in the cerebral cortex of an 8 month old control Pdgfrβ+/+ mouse and 1, 8 and 16 month old Pdgfrβ+/− mice. (B) The number of Iba1-positive microglia in the cortex of 1, 6–8 and 14–16 month old Pdgfrβ+/− mice (black bars) and age-matched Pdgfrβ+/+ controls (white bars). Total of 36 randomly chosen fields (420 × 420 μm) from 6 non-adjacent cortical sections were analyzed per mouse. (C) Bright-field microscopy analysis for neutrophils (red) using dichloracetate esterase staining in the cerebral cortex of an 8 month old Pdgfrβ+/+ mouse and 1, 8 and 16 month old Pdgfrβ+/− mice. MCAO, a positive control showing neutrophils infiltration (arrows) of ischemic brain tissue of a Pdgfrβ+/+mouse 24 h after permanent middle cerebral artery occlusion (MCAO). (D) The number of neutrophils in the cortex of 1, 6–8 and 14–16 month old Pdgfrβ+/− mice and mice receiving the MCAO compared to control 1 month old Pdgfrβ+/+ mice. (E–I) Real-time quantitative PCR for mouse interlukein-1 beta (Il-1β) (E) interlukein 6 (Il-6) (F) tumor necrosis factor alpha (Tnf-α) (G), chemokine C-C motif ligand 2 (Ccl2)(H) and intercellular adhesion molecule 1 (Icam-1) (I) mRNA in the cerebral cortex of 1, 6–8 and 14–16 month old Pdgfrβ+/− (black bars) and age-matched control Pdgfrβ+/+ (white bars) mice. In B, D and E–I, mean ± s.e.m, n=4–6 mice per group; *p<0.05 by one-way ANOVA. NS, non-significant.
Figure 10
Figure 10. Vascular-Mediated Neurodegeneration Following Pericyte Loss
PDGFRβ deficient signaling in brain pericytes leads to a progressive age-dependent pericyte loss resulting in (1) reductions in brain microcirculation with diminished cerebral blood flow (CBF) and CBF responses to a stimulus (CBF dysregulation) leading to a chronic perfusion stress and hypoxia, and (2) blood-brain barrier breakdown with accumulation of serum proteins and several cytotoxic and neurotoxic pathologic deposits in brain. Both, arms 1 and 2 may contribute to secondary neuronal injury and neurodegeneration mediated by a neurovascular insult.

Comment in

Similar articles

Cited by

References

    1. Alikhani M, Roy S, Graves DT. FOXO1 plays an essential role in apoptosis of retinal pericytes. Mol Vis. 2010;16:408–415. - PMC - PubMed
    1. Armulik A, Abramsson A, Betsholtz C. Endothelial/pericyte interactions. Circ Res. 2005;97:512–523. - PubMed
    1. Bauer HC, Bauer H, Lametschwandtner A, Amberger A, Ruiz P, Steiner M. Neovascularization and the appearance of morphological characteristics of the blood-brain barrier in the embryonic mouse central nervous system. Brain Res Dev Brain Res. 1993;75:269–278. - PubMed
    1. Bell RD, Deane R, Chow N, Long X, Sagare A, Singh I, Streb JW, Guo H, Rubio A, Van Nostrand W, Miano JM, Zlokovic BV. SRF and myocardin regulate LRP-mediated amyloid-beta clearance in brain vascular cells. Nat Cell Biol. 2009;11:143–153. - PMC - PubMed
    1. Boillee S, Yamanaka K, Lobsiger CS, Copeland NG, Jenkins NA, Kassiotis G, Kollias G, Cleveland DW. Onset and progression in inherited ALS determined by motor neurons and microglia. Science. 2006;312:1389–1392. - PubMed

Publication types

MeSH terms

Substances