. 2010 Nov 4;68(3):500-11.
doi: 10.1016/j.neuron.2010.09.026.

Dopaminergic modulation of axon initial segment calcium channels regulates action potential initiation

Affiliations

Dopaminergic modulation of axon initial segment calcium channels regulates action potential initiation

Kevin J Bender et al. Neuron. .

Abstract

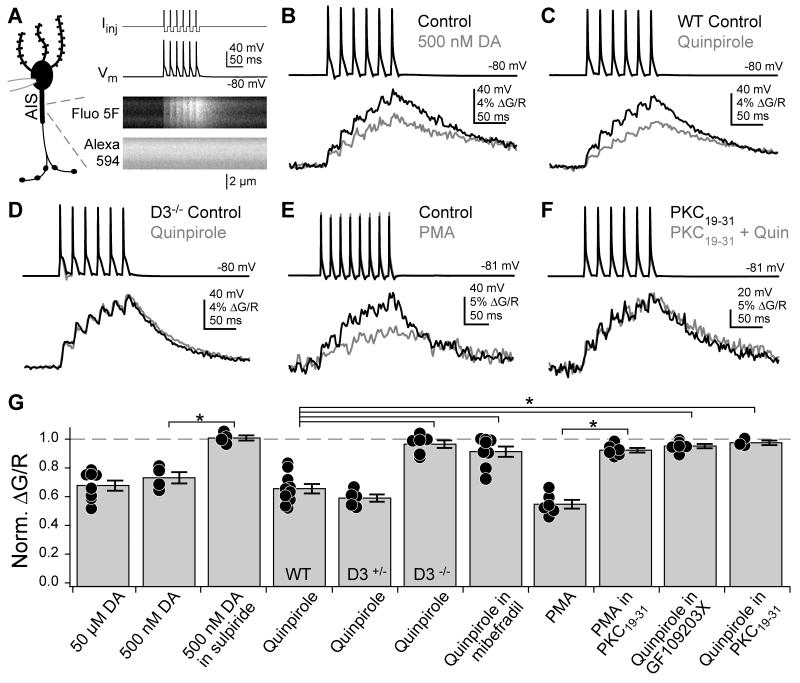
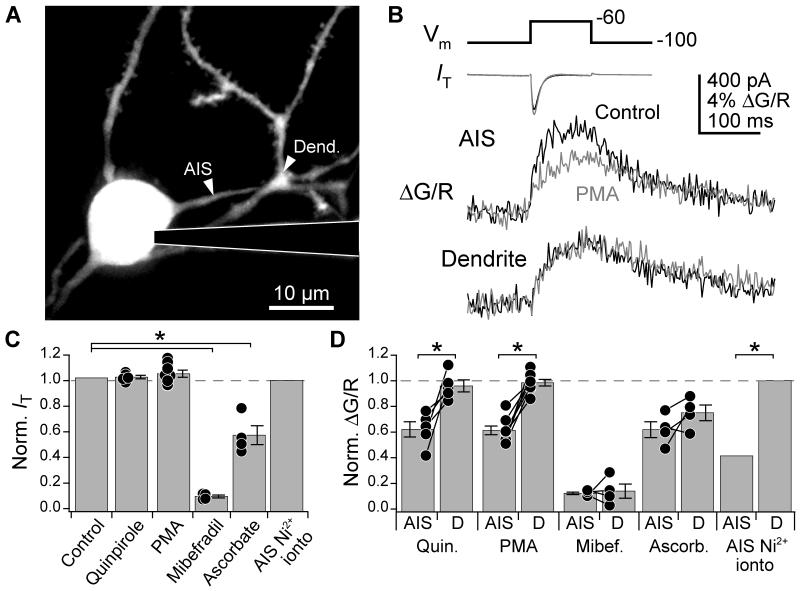
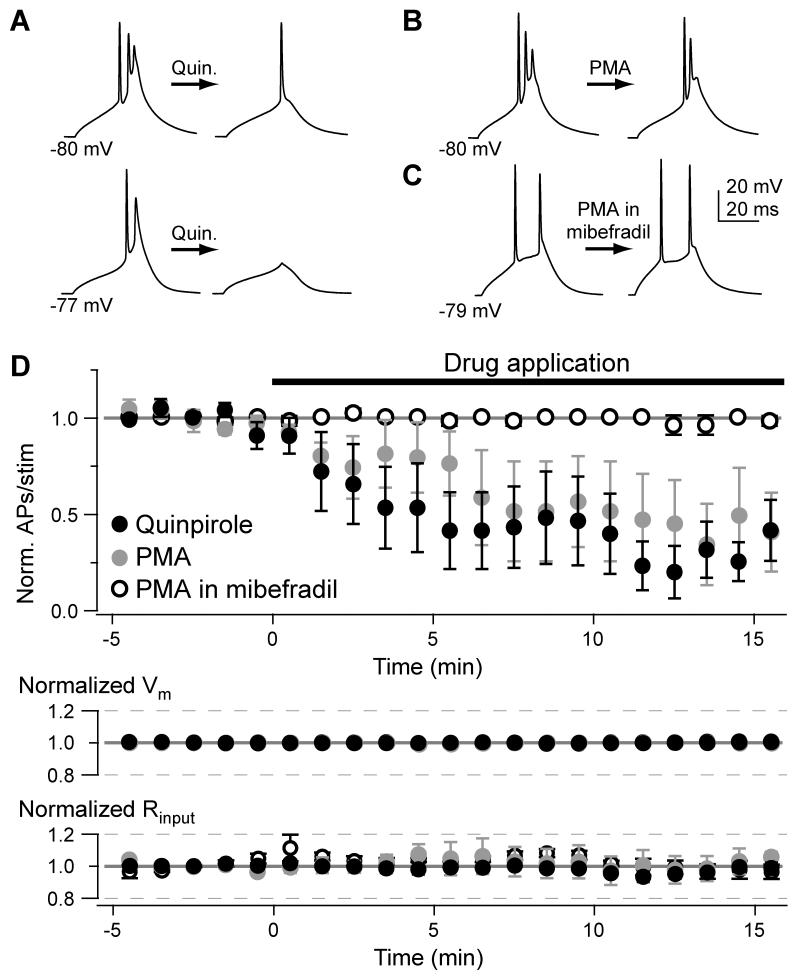
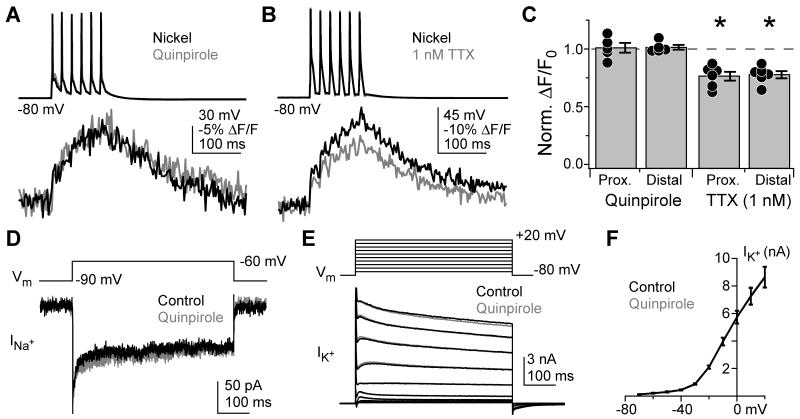
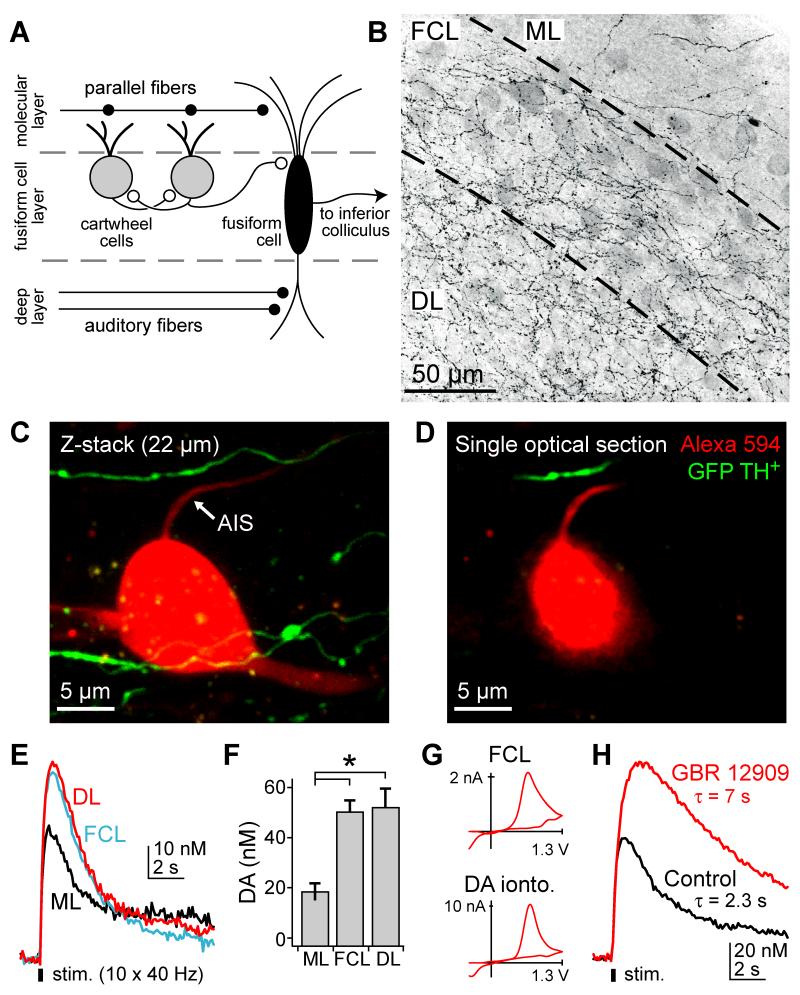
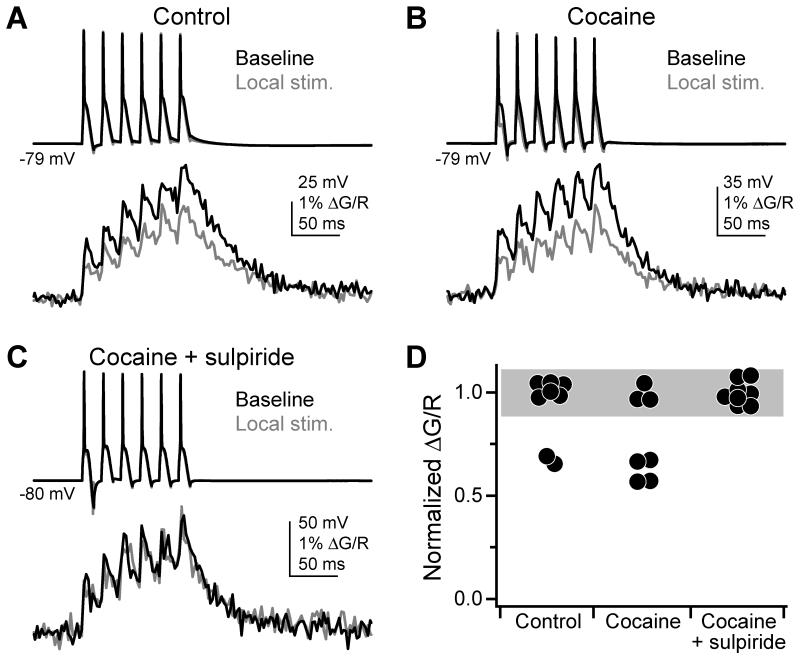
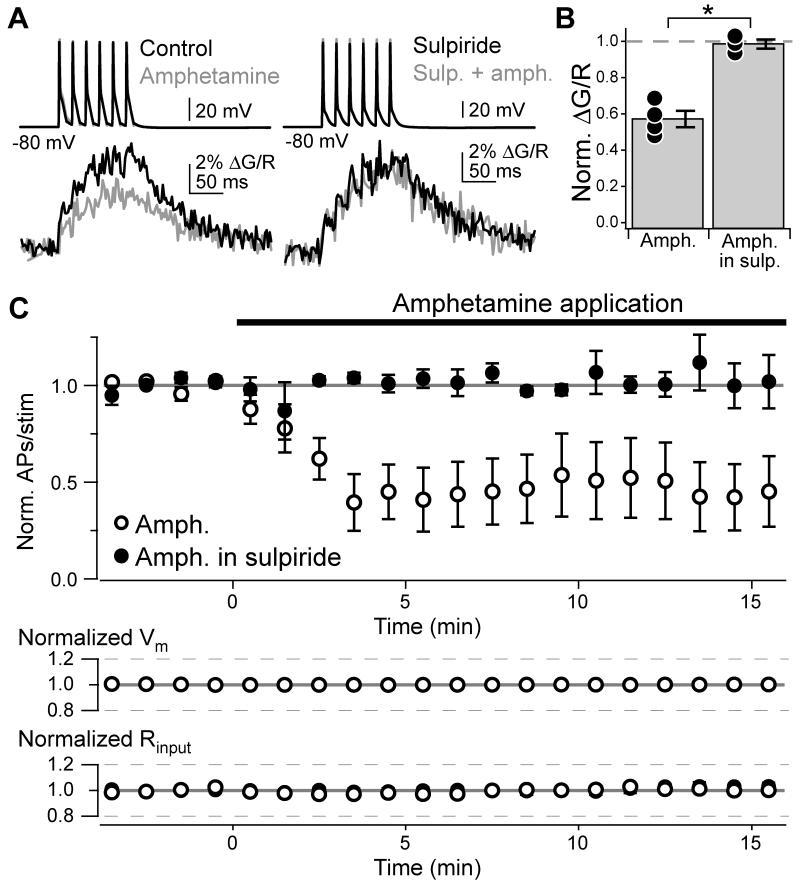
Action potentials initiate in the axon initial segment (AIS), a specialized compartment enriched with Na(+) and K(+) channels. Recently, we found that T- and R-type Ca(2+) channels are concentrated in the AIS, where they contribute to local subthreshold membrane depolarization and thereby influence action potential initiation. While periods of high-frequency activity can alter availability of AIS voltage-gated channels, mechanisms for long-term modulation of AIS channel function remain unknown. Here, we examined the regulatory pathways that control AIS Ca(2+) channel activity in brainstem interneurons. T-type Ca(2+) channels were downregulated by dopamine receptor activation acting via protein kinase C, which in turn reduced neuronal output. These effects occurred without altering AIS Na(+) or somatodendritic T-type channel activity and could be mediated by endogenous dopamine sources present in the auditory brainstem. This pathway represents a new mechanism to inhibit neurons by specifically regulating Ca(2+) channels directly involved in action potential initiation.


Figures

Fig. 1
Fig. 1. Dopamine reduces AIS Ca2+ transients in cartwheel cells
(A) Left: Schematic of recording/imaging configuration. Whole-cell recordings were made from cartwheel cell somata, and Ca2+ transients were imaged in the AIS. Top right: AP trains were evoked by somatic current injection followed by negative current steps to ensure that only 1 AP was evoked per step. Bottom right: corresponding Fluo-5F (Ca2+) and Alexa 594 (morphology) signals in AIS. (B-F) AP train-evoked Ca2+ influx in the AIS. Shades correspond to drug conditions to right of AP trains. All Ca2+ transients were computed as the change in green fluorescence (G, Fluo-5F) over red fluorescence (R, Alexa). DA: dopamine. WT: wild type. (G) Summary of pharmacological effects on AIS Ca2+. Values normalized to baseline ΔG/R amplitudes. For conditions expressed as “Drug X in Drug Y”, normalized ΔG/R amplitudes reflect any changes mediated by Drug X relative to a baseline period in Drug Y. Dots are single cells. Error bars are SEM. Asterisk: p < 0.0001.
Fig. 2
Fig. 2. D3R-PKC pathway is specific for T-type channels localized to the AIS
(A) 2-photon z-stack of cartwheel cell. Arrowheads: sites of Ca2+ transients detailed in (B). Left in AIS, right in dendrite. (B) Voltage steps from −100 to −60 mV evoked a whole cell T-current (IT) and Ca2+ transients in the AIS and dendrite. Black: baseline, grey: in PMA. (C-D) IT (C) and normalized ΔG/R (D) following activation of D3R-PKC pathway or block of T-type channels. Control currents were calculated as the relative IT over a time course similar to that allowed for drug wash-in (12 min). Ni2+ was iontophoresed locally to the AIS. All other drugs were added to the recording solution. Dots are single cells. Lines connecting dots in (D) link recordings made in the same cell in the AIS and dendrite. Dendritic recordings are denoted with a “D”. Bars are SEM. Asterisk: p < 0.05.
Fig. 3
Fig. 3. Dopamine reduces action potential output
(A) AP bursts evoked with somatic current injection during a baseline period (left) and after quinpirole application (right). Current injection was not altered over the course of an experiment. (B) Same as (A), but with PMA. (C) Same as (B), but in the presence of mibefradil throughout the recording. (D) Time course of AP inhibition by quinpirole and PMA. Data were normalized to the baseline number of APs evoked per stimulus. Bars are SEM.
Fig. 4
Fig. 4. D3R signaling does not affect Na+ or K+
(A) AP train-evoked Na+ influx in the AIS, imaged with SBFI, before (black) and after 1 μM quinpirole (grey). Na+ transients were computed as the change in SBFI fluorescence over baseline. (B) AP train-evoked Na+ influx in the AIS before (black) and after 1 nM TTX (grey). (C) Summary of pharmacological effects on AIS Na+. Values normalized to baseline ΔF/F0 amplitudes. Dots are single cells. Error bars are SEM. Asterisk: p < 0.01. (D) Persistent Na+ currents before (black) and after quinpirole (grey). (E) K+ currents before (black) and after quinpirole (grey). (F) K+ current vs. step voltage. Black: baseline. Grey: quinpirole. Data from each condition superimpose. Bars are SEM.
Fig. 5
Fig. 5. Monoamine anatomy and release in the DCN
(A) Schematic DCN circuit. Excitatory synapses are represented by filled circles, inhibitory synapses by open circles. Cartwheel cell somata are typically located near molecular/fusiform cell layer border. (B) TH+ axonal fibers in the DCN. Image is a z-stack of a 50 μm confocal series. Greyscale inverted for clarity. Dashed lines denote layer borders. ML: molecular layer, FCL: fusiform cell layer, DL: deep layer. (C) Z-stack of cartwheel cell filled with Alexa 594 in a slice from a TH-GFP animal. Recording pipette exits cell on left. GFP-TH+ axonal fibers are in green, cartwheel cell is filled with Alexa 594 (red). (D) Single optical section of closest apposition of TH+ fiber and cartwheel cell axon. (E) Fast-scan cyclic voltammetric recordings vs. time in DCN layers in response to local electrical stimulation in the same layer. Data are single traces all from one slice. Onset and offset of stimulation are indicated by the black bar. Layer abbreviations are as in (B). (F) Summary of peak dopamine amplitudes in cochlear nucleus layers. Bars are SEM. Asterisk: p < 0.001. n = 12 slices. Layer abbreviations are as in (B). (G) Top: Representative voltammagram recorded in the fusiform layer. Bottom: voltammagram in response to exogenous dopamine delivered via iontophoresis. (H) Effect of GBR 12909 on voltammetric recordings in the fusiform layer. Data are single traces.
Fig. 6
Fig. 6. Electrical stimulation of dopaminergic fibers affects AIS Ca2+
(A) AP train-evoked (top) Ca2+ transients (bottom) in the AIS, imaged with Fluo-4FF. Ca2+ transients were imaged before (black) and after (grey) dopamine release evoked with local electrical stimulation. (B) Same as (A), but with 300 nM cocaine present throughout experiment. (C) Same as (A), but with 300 nM cocaine and 200 nM sulpiride present throughout experiment. (D) Summary of endogenous dopaminergic fiber stimulation experiments. Values normalized to baseline ΔG/R amplitudes. Dots are single cells. Grey bar represents 2x standard deviation of the cocaine+sulpiride condition, centered on its mean. Any decrements in Ca2+ transients below this bar were considered successes.
Fig. 7
Fig. 7. Amphetamine reduces AIS Ca2+ and spike output
(A) AP train-evoked Ca2+ influx in the AIS, imaged with Fluo-5F. Colors correspond to drug conditions to right of AP trains. (B) Summary of amphetamine effects on AIS Ca2+. Dots are single cells. Bars are SEM. Asterisk: p < 0.05. (C) Time course of AP inhibition by amphetamine. When required, sulpiride was present throughout the recording. Data normalized to baseline number of APs evoked per stimulus. Bars are SEM.

References

    1. Astman N, Gutnick MJ, Fleidervish IA. Persistent sodium current in layer 5 neocortical neurons is primarily generated in the proximal axon. J Neurosci. 2006;26:3465–3473. - PMC - PubMed
    1. Azouz R, Gray CM. Dynamic spike threshold reveals a mechanism for synaptic coincidence detection in cortical neurons in vivo. Proc Natl Acad Sci U S A. 2000;97:8110–8115. - PMC - PubMed
    1. Bean BP. The action potential in mammalian central neurons. Nat Rev Neurosci. 2007;8:451–465. - PubMed
    1. Bender KJ, Trussell LO. Axon initial segment Ca2+ channels influence action potential generation and timing. Neuron. 2009;61:259–271. - PMC - PubMed
    1. Berrebi AS, Morgan JI, Mugnaini E. The Purkinje cell class may extend beyond the cerebellum. J Neurocytol. 1990;19:643–654. - PubMed

Publication types

MeSH terms

LinkOut - more resources