. 2010 Nov 5;7(5):593-605.
doi: 10.1016/j.stem.2010.09.015.

mTOR activation induces tumor suppressors that inhibit leukemogenesis and deplete hematopoietic stem cells after Pten deletion

Affiliations

mTOR activation induces tumor suppressors that inhibit leukemogenesis and deplete hematopoietic stem cells after Pten deletion

Jae Y Lee et al. Cell Stem Cell. .

Abstract

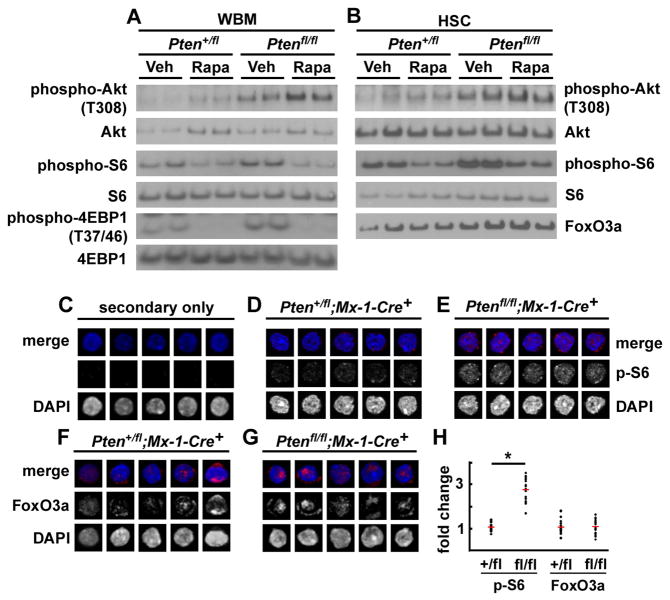
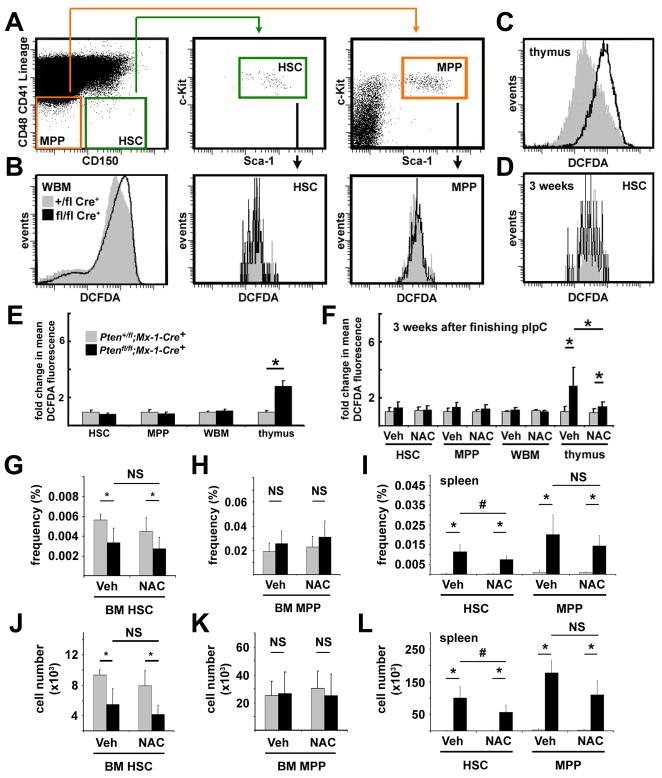
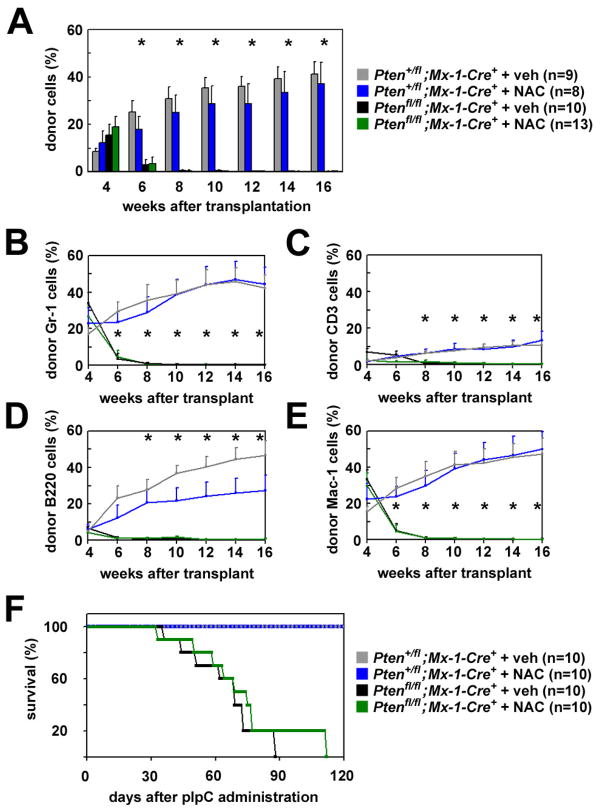
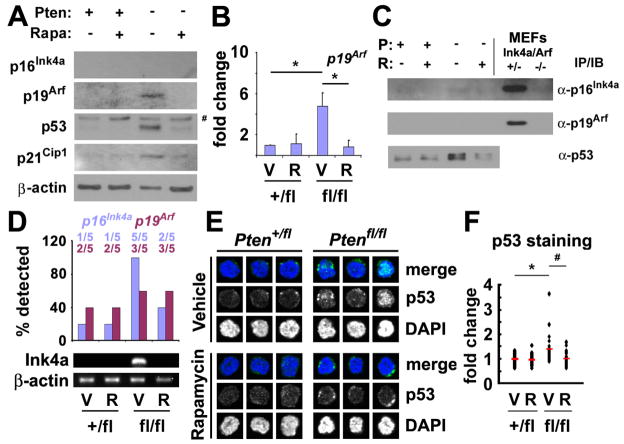
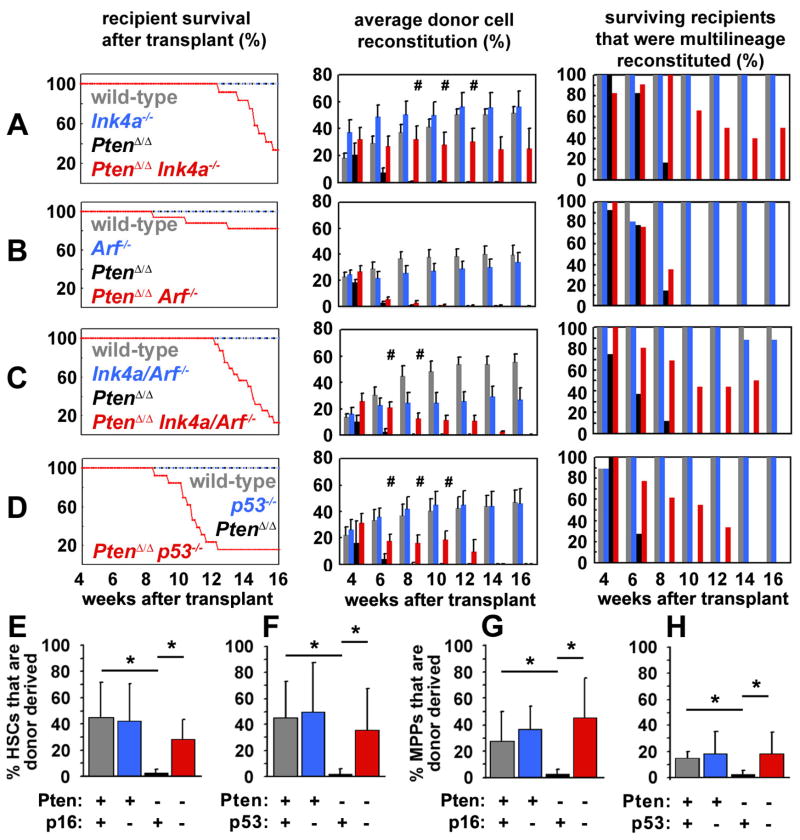
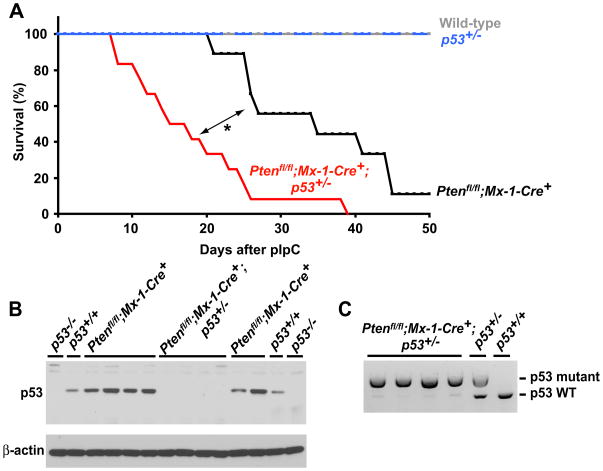
Pten deficiency depletes hematopoietic stem cells (HSCs) but expands leukemia-initiating cells, and the mTOR inhibitor, rapamycin, blocks these effects. Understanding the opposite effects of mTOR activation on HSCs versus leukemia-initiating cells could improve antileukemia therapies. We found that the depletion of Pten-deficient HSCs was not caused by oxidative stress and could not be blocked by N-acetyl-cysteine. Instead, Pten deletion induced, and rapamycin attenuated, the expression of p16(Ink4a) and p53 in HSCs, and p19(Arf) and p53 in other hematopoietic cells. p53 suppressed leukemogenesis and promoted HSC depletion after Pten deletion. p16(Ink4a) also promoted HSC depletion but had a limited role suppressing leukemogenesis. p19(Arf) strongly suppressed leukemogenesis but did not deplete HSCs. Secondary mutations attenuated this tumor suppressor response in some leukemias that arose after Pten deletion. mTOR activation therefore depletes HSCs by a tumor suppressor response that is attenuated by secondary mutations in leukemogenic clones.


Figures

Figure 1
Figure 1. Pten deletion activated Akt and mTORC1 signaling in HSCs but FoxO3a was not inactivated
(A, B) Pten deletion increased phospho-Akt (T308), phospho-S6, and phospho-4EBP1 (T37/46) levels in whole bone marrow cells (A) as well as in c-kit+Flk-2LinSca-1+CD48 HSCs (B) as expected. Rapamycin treatment tended to further increase phospho-Akt levels, but decreased phospho-S6, and phospho-4EBP1 (T37/46) levels, as expected. Quantification demonstrated that Pten deletion increased phospho-Akt levels by 2.6-fold and phospho-S6 levels by 1.5-fold by in HSCs. Rapamycin treatment further increased phospho-Akt levels by 1.7-fold in HSCs and decreased phospho-S6 levels by 40% in HSCs. Total protein levels of FoxO3a did not decrease with Pten deletion and were unaffected by rapamycin treatment (B). Each lane contained protein extracted from 40,000 sorted cells. (C–H) Staining of sorted CD150+CD48CD41Linc-kit+Sca-1+ HSCs with secondary antibody alone (C), or primary and secondary antibody against phospho-S6 (D–E) or FoxO3a (F–G). Phospho-S6 staining was significantly elevated in Ptenfl/flMx-1-Cre+ HSCs as compared to Pten+/flMx-1-Cre+ control HSCs, as expected (D–E, H; *, p<0.0001 by Student’s t-test), but the level and subcellular localization of FoxO3a staining did not differ between Ptenfl/flMx-1-Cre+ and control HSCs (F–H). We analyzed 10–30 HSCs from 1–2 mice/genotype in each of 3 independent experiments. In a similar assay, culture of HSCs in medium containing SCF and TPO did lead to decreased total FoxO3a levels and cytoplasmic localization (Fig. S3). See also Figures S1, S2, S3.
Figure 2
Figure 2. Pten deletion significantly increased ROS levels in thymocytes but not in HSCs, MPPs, or whole bone marrow cells and NAC treatment failed to rescue the depletion of HSCs
(A) Gating scheme used to assess intracellular ROS levels in CD150+CD48CD41Linc-kit+Sca-1+ HSCs and CD150CD48CD41Linc-kit+Sca-1+ MPPs. 7 (B) or 21 (D) days after finishing pIpC treatment (7 doses of pIpC over 14 days), DCFDA staining of whole bone marrow cells, HSCs, and MPPs did not significantly differ between Ptenfl/flMx-1-Cre+ and Pten+/flMx-1-Cre+ control mice. (C) In contrast, thymocytes from Ptenfl/flMx-1-Cre+ mice did exhibit significantly greater DCFDA staining than thymocytes from Pten+/flMx-1-Cre+ controls. (E) Mean DCFDA fluorescence levels showed no evidence of increased ROS levels in HSCs, MPPs, or bone marrow cells, but a significant (*, p<0.05 by Student’s t-test) increase in ROS levels within thymocytes. Similar experiments performed 21 days after finishing pIpC treatment yielded similar results (F). Daily subcutaneous injections of NAC after pIpC treatment did not significantly affect DCFDA staining of HSCs, MPPs, or bone marrow cells, but did significantly reduce DCFDA staining of thymocytes (F). The frequency (G) and absolute number (J) of CD150+CD48CD41Linc-kit+Sca-1+ HSCs in the bone marrow declined significantly after Pten deletion but were not affected by NAC. The frequency (H) and absolute number (K) of CD150CD48CD41Linc-kit+Sca-1+ MPPs in the bone marrow were not affected by Pten deletion or NAC. The frequency (I) and absolute number (L) of HSCs and MPPs in the spleen significantly increased after Pten deletion. The increase in HSCs was slightly but significantly (#, p<0.05) attenuated by NAC treatment but the increase in MPPs was not significantly affected (I, L). Data (mean±standard deviation) are from 4 independent experiments with 1–2 mice/genotype/treatment. See also Figure S4.
Figure 3
Figure 3. NAC treatment did not restore the reconstituting capacity of HSCs or block leukemogenesis after Pten-deletion
(A–E) After pIpC treatment, 10 donor CD150+CD48CD41Linc-kit+Sca-1+ HSCs were transplanted into lethally irradiated recipients along with 300,000 recipient bone marrow cells, and recipients were maintained on daily injections of NAC or vehicle beginning the day after transplantation. Control (Pten+/flMx-1-Cre+) HSCs gave high levels of long-term multilineage reconstitution by donor Gr-1+ myeloid (B), CD3+ T (C), B220+ B (D), and Mac-1+ myeloid cells (E) in all recipients, irrespective of NAC treatment. Pten-deleted (Ptenfl/flMx-1-Cre+) HSCs gave transient multilineage reconstitution in all recipients, and significantly (*, p<0.05 by Student’s t-test) lower levels of donor reconstitution in all lineages (BE), irrespective of NAC treatment. NAC treatment did not significantly affect reconstitution levels from either Pten-deleted or control HSCs. Data represent mean±SEM from 3 independent experiments. (F) In 2 independent experiments, 1×10⁶ unexcised donor cells from Ptenfl/flMx-1-Cre+ or Pten+/flMx-1-Cre+ mice were transplanted into irradiated recipient mice. Six weeks later Pten was deleted by pIpC treatment, then recipients were given daily injections of NAC or vehicle. NAC treatment did not prolong the survival of mice or delay the onset of leukemia after Pten deletion. None of the recipients of control cells developed neoplasms but all mice with Pten-deficient cells had MPD and/or T-ALL when they died, irrespective of NAC treatment. See also Figure S5.
Figure 4
Figure 4. Pten deletion increased p19Arf, p21Cip1, and p53 expression in splenocytes, and p16Ink4a and p53 in HSCs, and rapamycin attenuated these increases
(A) Levels of p16Ink4a, p19Arf, p21Cip1, and p53 were assessed by Western blot in unfractionated splenocytes from Ptenfl/flMx-1-Cre+ mice and Pten+/flMx-1-Cre+ controls 14 days after pIpC treatment. Mice were given daily injections of rapamycin or vehicle after pIpC treatment ended. Analysis of p53-deficient MEFs (data not shown) indicated that the upper band (#) was not specific for p53 but the lower band was. This blot is representative of 3 independent experiments. (B) We also observed increased p19Arf transcript levels by qPCR in splenocytes after Pten deletion and this effect was attenuated by rapamycin treatment (mean±SD from 3 independent experiments). (C) 4 weeks after pIpC treatment ended, 2×10⁶ Linc-kit+ stem/progenitor cells were sorted from control and Pten-deleted mice and cell lysates were immunoprecipitated using antibodies against p16Ink4a, p19Arf, and p53 before Western blotting. p16Ink4a and p53 levels increased in Pten-deleted cells, but we detected no increase in p19Arf. MEFs that were deficient or heterozygous for p16Ink4a/p19Arf were used as negative and positive controls. (D) p16Ink4a transcript could always be amplified from Pten deficient CD150+CD48CD41Linc-kit+Sca-1+ HSCs (5 of 5 samples) but usually not from control (1 of 5) or rapamycin-treated Pten deficient samples (2 of 5) 4 weeks after Pten deletion. p19Arf transcripts could only be amplified from about half of the samples, irrespective of Pten deletion or rapamycin treatment (data are from 5 independent experiments). (E, F) 4 weeks after pIpC treatment ended, CD150+CD48CD41Linc-kit+Sca-1+ HSCs from Pten-deleted mice exhibited higher levels of immunofluorescence for p53 than control HSCs or Pten deleted HSCs treated with rapamycin. (F) The average staining intensity for p53 increased 1.4-fold (*, p<0.008 by Student’s t-test) in Pten-deleted HSCs as compared to control HSCs. Rapamycin treatment rescued this effect (#, p<0.003 by Student’s t-test; data are from 30 HSCs per group compiled from 2 independent experiments). None of the mice studied in this figure showed any signs of hematopoietic neoplasms. See also Figure S6.
Figure 5
Figure 5. Deficiency for p19Arf or p53, but not p16Ink4a, accelerated leukemogenesis after Pten-deletion
1×10⁶ donor bone marrow cells from mice with the indicated genotypes were transplanted into irradiated recipient mice along with 500,000 recipient bone marrow cells. Six weeks after transplantation, all recipients were treated with pIpC and their survival was monitored over time (up to 165 days after pIpC treatment ended). (A) Recipients of Ptenfl/flMx-1-Cre+p16Ink4a/p19Arf−/− cells (displayed as PtenΔ/Δp16Ink4a/p19Arf−/−) exhibited significantly (*, p<0.02 by Student’s t-test) accelerated death as compared to recipients of Ptenfl/flMx-1-Cre+ cells (PtenΔ/Δ). Mice were sacrificed when moribund and their hematopoietic tissues analyzed. The neoplasms observed in each mouse at the time of sacrifice included myeloproliferative disease (MPD), T-ALL, MPD+T-ALL, histiocytic sarcoma (HS), and HS+T-ALL. (B) Recipients of Ptenfl/flMx-1-Cre+p19Arf−/− cells (PtenΔ/Δp19Arf−/−) exhibited significantly (*, p<0.02 by log-rank test) accelerated death from leukemogenesis as compared to recipients of Ptenfl/flMx-1-Cre+ cells (PtenΔ/Δ). (C) Recipients of Ptenfl/flMx-1-Cre+p16Ink4a (PtenΔ/Δp16Ink4a) cells died at a similar rate and with similar neoplasms as recipients of Ptenfl/flMx-1-Cre+ cells (PtenΔ/Δ). (D) Recipients of Ptenfl/flMx-1-Cre+p53−/− cells (PtenΔ/Δp53−/−) exhibited significantly (**, p<0.0001 by log-rank test) accelerated death from leukemogenesis as compared to recipients of Ptenfl/flMx-1-Cre+ cells (PtenΔ/Δ). Data are from 3 independent experiments with a total of 9 mice/genotype except for compound mutant mice, which had 14–20 mice/genotype.
Figure 6
Figure 6. Deficiency for p16Ink4a or p53 prolonged the reconstituting capacity of Pten-deficient HSCs
(A) 10 CD150+CD48CD41Linc-kit+Sca-1+ cells were sorted from mice with each of the indicated genotypes after pIpC treatment and co-injected with 300,000 recipient bone marrow cells into irradiated recipient mice. The survival, donor cell reconstitution levels (mean±SEM), and percentage of surviving recipients with multilineage reconstitution by donor cells were monitored for 16 weeks after transplantation. In all experiments, recipients of wild-type cells (A–D) and recipients of p16Ink4a-deficient cells (A), p19Arf-deficient cells (B), p16Ink4a/p19Arf-deficient cells (C) or p53-deficient cells (D) survived for the duration of the experiment and showed high levels of long-term multilineage reconstitution by donor cells. In contrast, recipients of Pten-deficient cells showed only transient multilineage reconstitution for 4 to 8 weeks in each experiment (A–D). HSCs that were compound mutant for Pten in addition to p16Ink4a (A), p16Ink4a/p19Arf (C) or p53 (D) gave significantly (#, p<0.05 by Student’s t-test) higher levels of donor cell reconstitution and multilineage reconstitution for a significantly longer period of time as compared to HSCs that were deficient only for Pten. The degree of donor cell reconstitution provided by Ptenfl/fl;Mx-1-Cre+;p16Ink4a cells (A) did not significantly differ from Ptenfl/fl;Mx-1-Cre+;p16Ink4a/p19Arf cells (C). p19Arf deficiency did not significantly affect the duration or level of reconstitution by Pten-deficient HSCs (B). Compound mutant mice that died had MPD, T-ALL, and/or histiocytic sarcoma at the time of death. All data are from 3 independent experiments with a total of 7–17 recipients per treatment. (E–H) Mice were transplanted with mutant HSCs as described above then sacrificed 8 weeks later to assess the frequency of donor CD150+CD48CD41Linc-kit+Sca-1+ HSCs and CD150CD48CD41Linc-kit+Sca-1+ MPPs. Donor HSCs and MPPs were not detectable by this time point in the absence of Pten but depletion was rescued by either p16Ink4a deficiency (E,G) or p53 deficiency (F,H; *, p<0.05 by Student’s t-test). These data are from 3 independent experiments with a total of 3–8 recipients per treatment. Consistent with Figure 6, transplantation of higher doses of Pten-deficient CD150+CD48CD41Linc-kit+Sca-1+ cells into irradiated wild-type mice led to the development of leukemia in a higher proportion of the recipient mice (Table S1). See also Figure S7 and Table S1.
Figure 7
Figure 7. Some Pten-deficient leukemias inactivate p53
(A) Wild-type, p53+/−, Ptenfl/fl;Mx-1-Cre+;p53+/+, and Ptenfl/fl;Mx-1-Cre+;p53+/− mice 5 to 6 weeks of age were treated with three doses of pIpC then monitored. Ptenfl/fl;Mx-1-Cre+;p53+/− mice died significantly more quickly than Ptenfl/fl;Mx-1-Cre+;p53+/+ mice (p=0.0008 by log-rank test). (B) Western blotting of thymocytes from Ptenfl/fl;Mx-1-Cre+;p53+/+ and Ptenfl/fl;Mx-1-Cre+;p53+/− mice with T-ALL showed strongly diminished expression of p53 in the Ptenfl/fl;Mx-1-Cre+;p53+/− cells. (C) Genomic PCR analysis of thymocytes from Ptenfl/fl;Mx-1-Cre+;p53+/− mice showed a significantly diminished band corresponding to the wild-type p53 allele suggesting loss of heterozygosity. The weak wild-type p53 band may reflect residual normal thymocytes or thymic stromal cells. 9–12 mice/genotype were used in this experiment.

Similar articles

Cited by

References

    1. Aggerholm A, Gronbaek K, Guldberg P, Hokland P. Mutational analysis of the tumour suppressor gene MMAC1/PTEN in malignant myeloid disorders. European journal of haematology. 2000;65:109–113. - PubMed
    1. Akala OO, Park IK, Qian D, Pihalja M, Becker MW, Clarke MF. Long-term haematopoietic reconstitution by Trp53−/−p16Ink4a−/−p19Arf−/− multipotent progenitors. Nature. 2008;453:228–232. - PubMed
    1. Biggs WH, 3rd, Meisenhelder J, Hunter T, Cavenee WK, Arden KC. Protein kinase B/Akt-mediated phosphorylation promotes nuclear exclusion of the winged helix transcription factor FKHR1. Proceedings of the National Academy of Sciences of the United States of America. 1999;96:7421–7426. - PMC - PubMed
    1. Brunet A, Bonni A, Zigmond MJ, Lin MZ, Juo P, Hu LS, Anderson MJ, Arden KC, Blenis J, Greenberg ME. Akt promotes cell survival by phosphorylating and inhibiting a Forkhead transcription factor. Cell. 1999;96:857–868. - PubMed
    1. Chang H, Qi XY, Claudio J, Zhuang L, Patterson B, Stewart AK. Analysis of PTEN deletions and mutations in multiple myeloma. Leukemia research. 2006;30:262–265. - PubMed

Publication types

Substances