. 2010 Nov 5;7(5):606-17.
doi: 10.1016/j.stem.2010.09.013.

Mdm2 is required for survival of hematopoietic stem cells/progenitors via dampening of ROS-induced p53 activity

Affiliations

Mdm2 is required for survival of hematopoietic stem cells/progenitors via dampening of ROS-induced p53 activity

Hussein A Abbas et al. Cell Stem Cell. .

Abstract

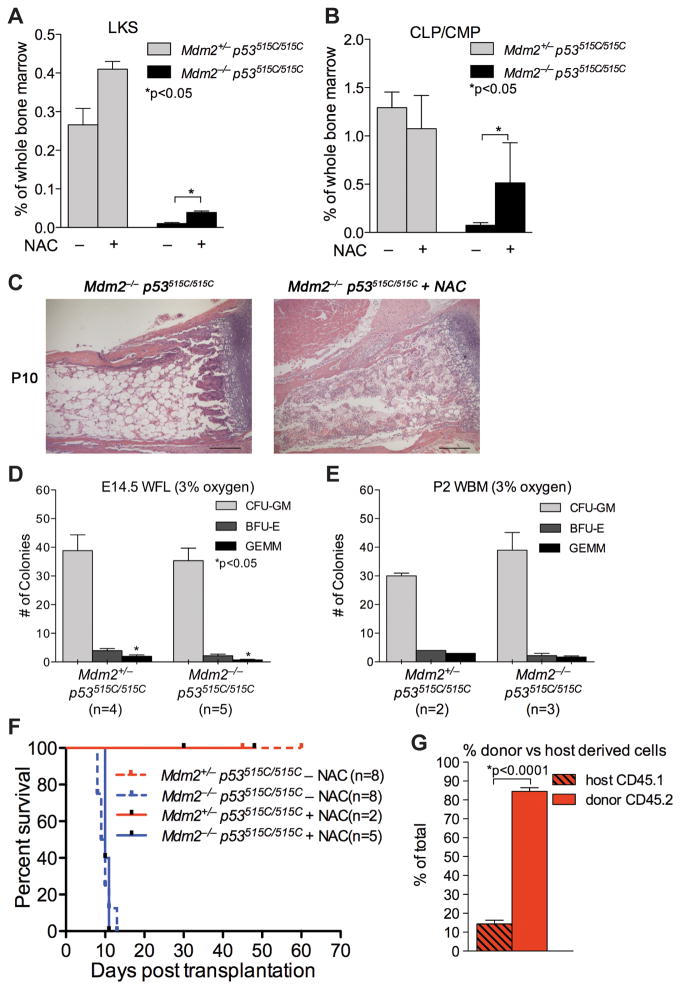
Mdm2 is an E3 ubiquitin ligase that targets p53 for degradation. p53(515C) (encoding p53R172P) is a hypomorphic allele of p53 that rescues the embryonic lethality of Mdm2(-/-) mice. Mdm2(-/-) p53(515C/515C) mice, however, die by postnatal day 13 resulting from hematopoietic failure. Hematopoietic stem cells and progenitors of Mdm2(-/-) p53(515C/515C) mice were normal in fetal livers but were depleted in postnatal bone marrows. After birth, these mice had elevated reactive oxygen species (ROS) thus activating p53R172P. In the absence of Mdm2, stable p53R172P induced ROS and cell cycle arrest, senescence, and cell death in the hematopoietic compartment. This phenotype was partially rescued with antioxidant treatment and upon culturing of hematopoietic cells in methycellulose at 3% oxygen. p16 was also stabilized because of ROS, and its loss increased cell cycling and partially rescued hematopoiesis and survival. Thus, Mdm2 is required to control ROS-induced p53 levels for sustainable hematopoiesis.


Figures

Figure 1
Figure 1. Mdm2−/− p53515C/515C mice die postnatally due to hematopoietic failure
(A) Kaplan-Meier survival curves of Mdm2−/− p53515C/515C, Mdm2+/−p53515C/515C and Mdm2+/+ p53515C/515C mice. (B) Representative H&E staining of fetal livers (FL) at E14.5 and bone marrows (BM) at E18.5, P6, P8 and P10 from Mdm2+/−p53515C/515C (left) and Mdm2−/− p53515C/515C mice (right). Scale bar is 200μm (C) Immunohistochemical staining of p53R172P on paraffin-embedded sections of E14.5 fetal livers, and E18.5, P6, P8 and P10 bone marrows from Mdm2+/−p53515C/515C (left) and Mdm2−/− p53515C/515C (right). Scale bar is 50μm.
Figure 2
Figure 2. p53R172P transcriptional activity induces cell cycle arrest and senescence
(A) Expression levels of p53 regulated cell cycle (Ccng1, p21) and apoptosis (Perp, Puma and Noxa) genes were measured by Real Time RT-PCR from RNA of whole bone marrows (WBM) at P6 and were normalized to Gapdh levels. (B) Expression levels of senescence markers at P6 of whole bone marrow (WBM) RNA was measured by Real Time RT-PCR and was normalized to Gapdh levels. Sequences of primers used in A–B are listed in Supplementary Table 1. (C) Percent of SA-βgal positive cells of total P6-P8 whole bone marrows. (D–E) Cell cycle analysis of E14.5 whole fetal livers (WFL) (D) and P6 whole bone marrow (WBM) (E) using propidium iodide on fixed cells of these tissues. (F) Cleaved caspase-3 immunohistochemical staining on paraffin embedded bone marrows of Mdm2+/−p53515C/515C (left) and Mdm2−/− p53515C/515C (right) at P6 and P8. Insert is positive control. Scale bar is 50μm. Error bars represent standard error of the mean. See also Figure S1.
Figure 3
Figure 3. HSC and progenitors are not affected in fetal livers but ebb gradually after birth
(A) Percentage of LKS population of whole tissues from E14.5 fetal livers (FL), and E18.5, P4, P6, P8 and P10 bone marrows (BM). N>3 for all samples. (B) Percentages of CLP/CMP population of whole tissues from same time points as in (A). N>3 for all samples. (C–D) Percentage of SLAM-LKS cells of whole fetal liver at E14.5 (C) and whole bone marrow at P6 (D). (E–F) Quantification of CFU-GM, BFU-E and GEMM colonies from methocult cultures of 20,000 Mdm2+/+ p53515C/515C, Mdm2+/−p53515C/515C and Mdm2−/− p53515C/515C whole fetal liver (WFL) cells (E) and whole bone marrow (WBM) (F) cells at E14.5 and P2, respectively. Error bars represent standard error of the mean. See also Figure S2.
Figure 4
Figure 4. Increased ROS levels in postnatal bone marrows of Mdm2−/− p53515C/515C mice
(A) ROS levels were measured in whole tissues (fetal livers (FL) and bone marrows (BM) at E14.5 and P6 using DCFDA intensity as a readout. (B) Measurement of ROS levels with DCFDA in LKS populations of E14.5 fetal liver (FL) and P6 bone marrow (BM). See also Figure S3. (C) ROS in CLP/CMP in P6 bone marrows. Fold difference is relative to ROS levels of CLP/CMP of Mdm2+/−p53515C/515C pups. (D) Measurement of ROS levels in whole liver and whole bone marrows in P6 pups. ROS levels of Mdm2+/−p53515C/515C whole livers were set to 1. (E–F) Measurement of transcript levels of Pig1, Pig8 and Pig12 from whole bone marrow (WBM) cells at P6 (E) and P10 (F) from Mdm2−/− p53515C/515C compared to Mdm2+/−p53515C/515C measured by Real Time RT-PCR and normalized to Gapdh levels. Error bars represent standard error of the mean.
Figure 5
Figure 5. Rescue of hematopoietic defects upon treatment with NAC or culturing at 3% oxygen
(A–B) LKS (A) and CLP/CMP (B) populations of whole bone marrows at P6 for NAC treated and untreated mice. (C) Representative H&E staining for P10 bone marrow of a Mdm2−/− p53515C/515C mouse treated with NAC (right) compared to untreated (left). Scale bar is 200μm. (D–E) 20,000 cells of Mdm2+/−p53515C/515C and Mdm2−/− p53515C/515C whole fetal livers (WFL) and whole bone marrow (WBM) cells were cultured at 3% oxygen and the number of CFU-GM, BFU-E and GEMM colonies were quantified. (F) Survival curve of CD45.1 mice transplanted with 0.5×10⁶ Mdm2+/−p53515C/515C or Mdm2−/− p53515C/515C whole bone marrow cells, supplemented with or without NAC in drinking water. (G) Percent of donor derived CD45.2 cells from peripheral blood assay at 5–6 weeks after transplantation. Error bars represent standard error of the mean. See also Figure S4.
Figure 6
Figure 6. p16 is stabilized in Mdm2−/− p53515C/515C bone marrows and its loss rescues bone marrow cellularity
(A) Immunohistochemical staining of p16 in P6, P8 and P10 bone marrows of Mdm2+−/p53515C/515C (left) and Mdm2−/− p53515C/515C (right) mice. Hematoxylin (blue) is nuclear counterstain. Scale bar is 50μm. (B) Immunofluorescence staining of P8 bone marrows for p16 using a different antibody than (A). Arrows indicate cytoplasmic or nuclear staining. (C) H&E staining of P10 bone marrows from Mdm2−/− p53515C/515C (left) and Mdm2−/− p53515C/515C p16−/− (right) mice. Scale bar is 200μm. (D) Percentage of bone marrow cellularity of Mdm2−/− p53515C/515C p16−/− mice compared to Mdm2+−/p53515C/515C p16−/− littermates at P10. (E) Kaplan-Meier survival curve of Mdm2−/− p53515C/515C p16−/− mice (n=15) compared to Mdm2−/− p53515C/515C mice (n=26).
Figure 7
Figure 7. Partial rescue of LKS and CLP/CMP populations in Mdm2−/− p53515C/515C p16−/− mice
(A) p53R172P immunohistochemical analysis on P10 bone marrows (BM) of Mdm2−/− p53515C/515C (left) and Mdm2−/− p53515C/515C p16−/− (right) mice. Scale bar is 50μm. (B) Cell cycle status of P6 whole bone marrow cells (WBM) of Mdm2−/− p53515C/515C with and without p16. (C–D) LKS (C) and CLP/CMP (D) populations of P6 whole bone marrow of Mdm2−/− p53515C/515C p16−/− mice compared to Mdm2−/− p53515C/515C mice. (E) Suggested model for activation of p53 during hematopoiesis postnatally. Error bars represent standard error of the mean.

References

    1. Bowie MB, McKnight KD, Kent DG, McCaffrey L, Hoodless PA, Eaves CJ. Hematopoietic stem cells proliferate until after birth and show a reversible phase-specific engraftment defect. The Journal of clinical investigation. 2006;116:2808–2816. - PMC - PubMed
    1. Brugarolas J, Bronson RT, Jacks T. p21 is a critical CDK2 regulator essential for proliferation control in Rb-deficient cells. The Journal of cell biology. 1998;141:503–514. - PMC - PubMed
    1. Chen Q, Fischer A, Reagan JD, Yan LJ, Ames BN. Oxidative DNA damage and senescence of human diploid fibroblast cells. Proceedings of the National Academy of Sciences of the United States of America. 1995;92:4337–4341. - PMC - PubMed
    1. Cheng T, Rodrigues N, Shen H, Yang Y, Dombkowski D, Sykes M, Scadden DT. Hematopoietic stem cell quiescence maintained by p21cip1/waf1. Science (New York, NY) 2000;287:1804–1808. - PubMed
    1. Collado M, Gil J, Efeyan A, Guerra C, Schuhmacher AJ, Barradas M, Benguria A, Zaballos A, Flores JM, Barbacid M, et al. Tumour biology: senescence in premalignant tumours. Nature. 2005;436:642. - PubMed

Publication types

Substances