. 2011 Jun;21(6):1231-45.
doi: 10.1093/cercor/bhq199. Epub 2010 Nov 1.

Developmental dynamics of piriform cortex

Affiliations

Developmental dynamics of piriform cortex

Amy A Sarma et al. Cereb Cortex. 2011 Jun.

Abstract

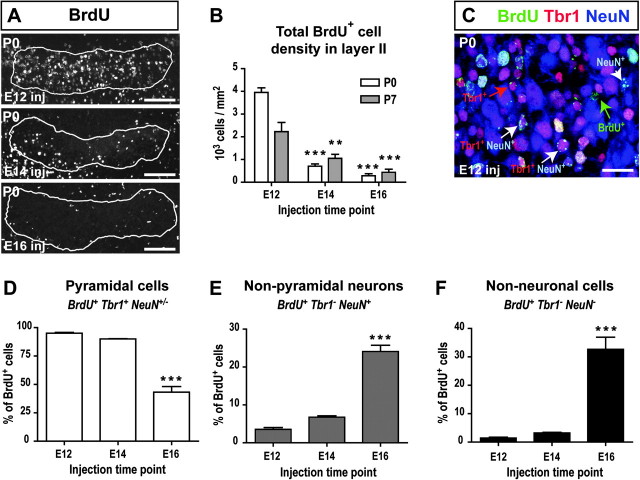
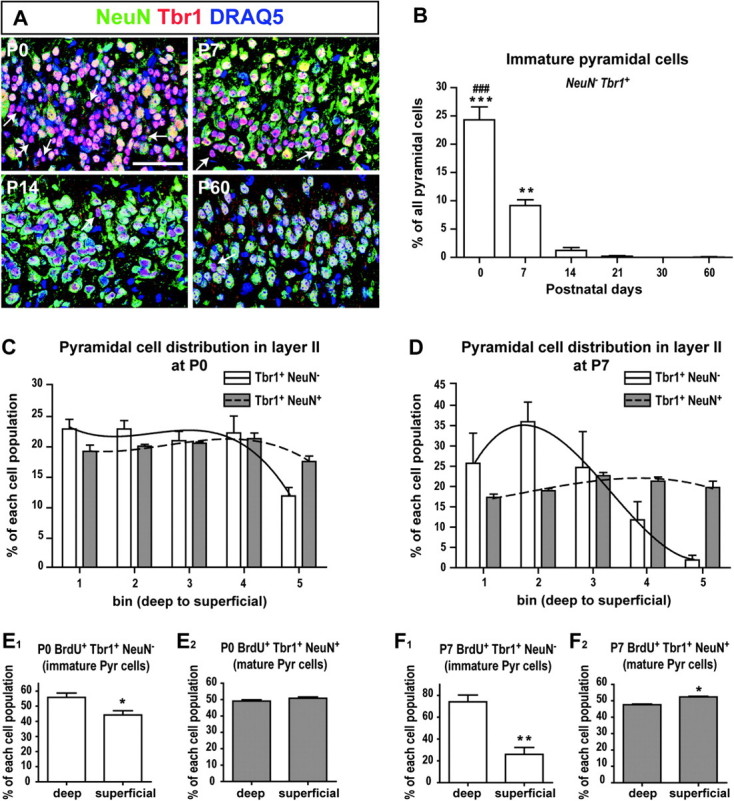
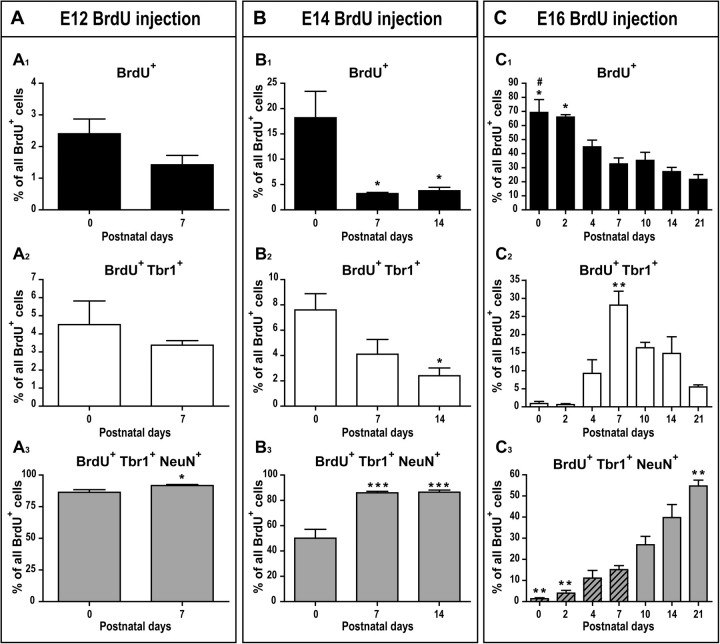
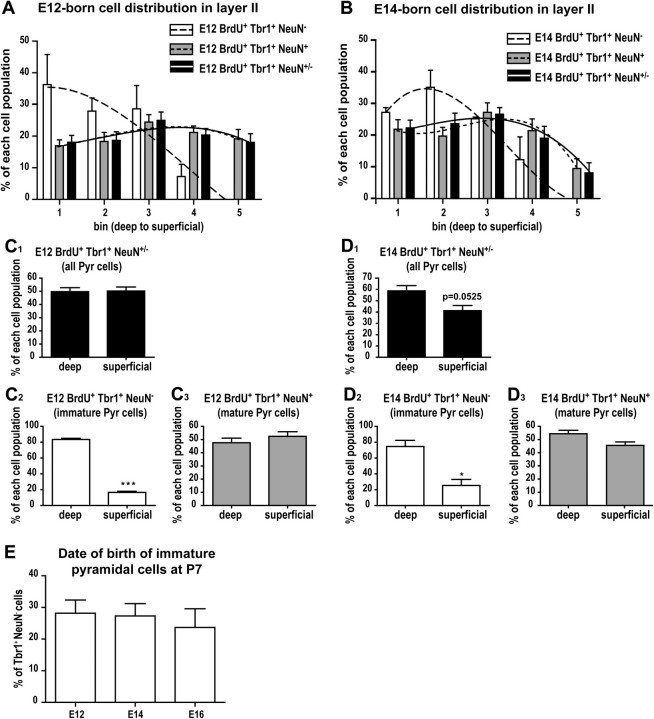
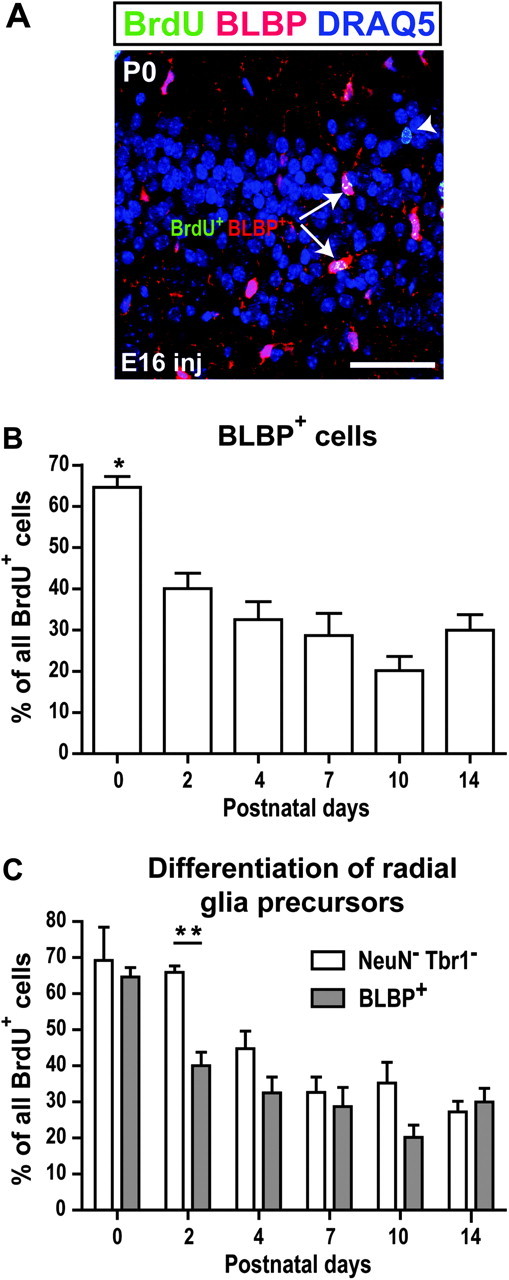
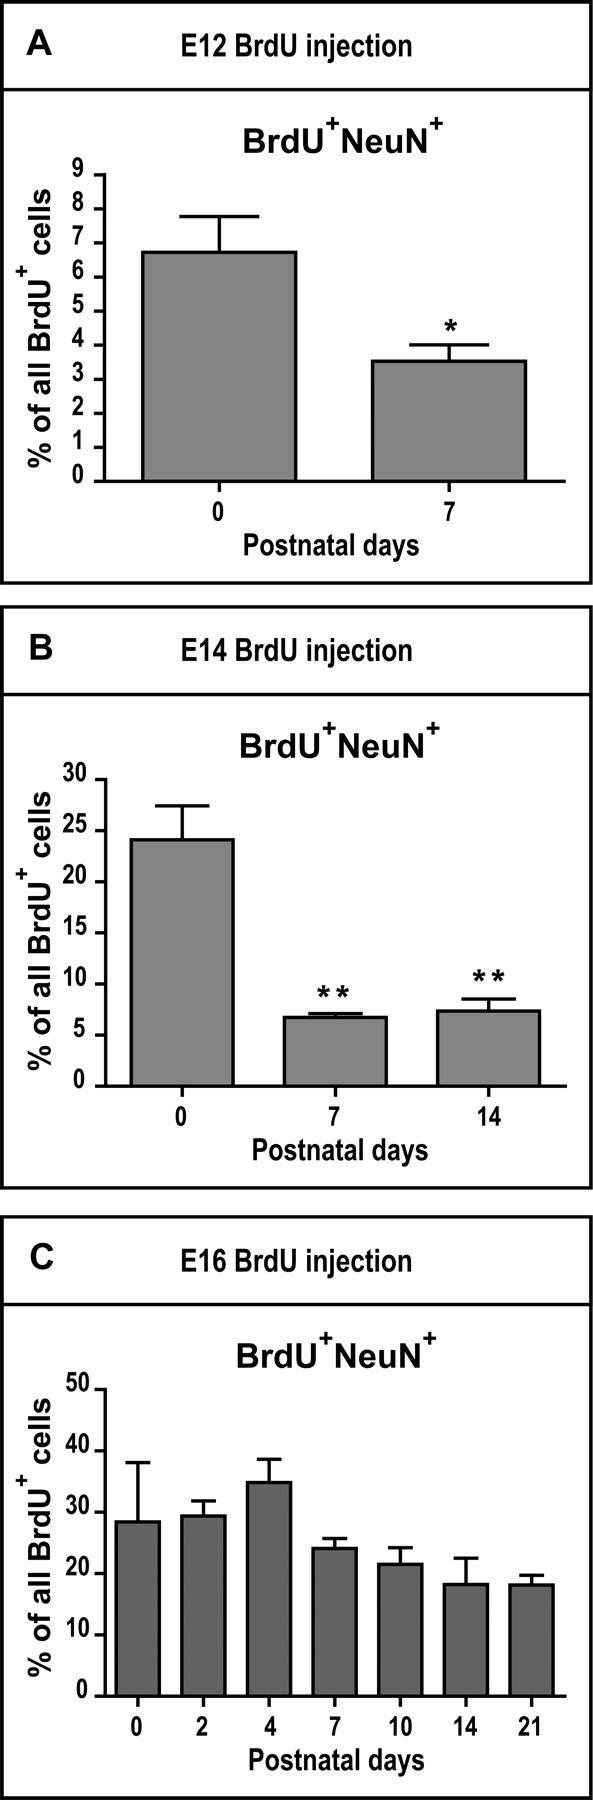
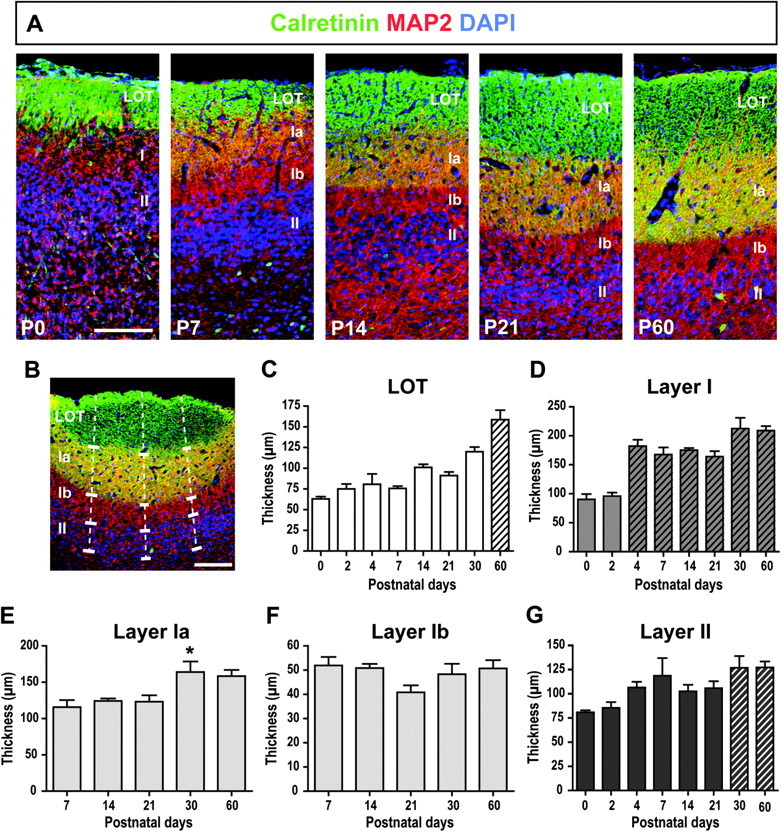
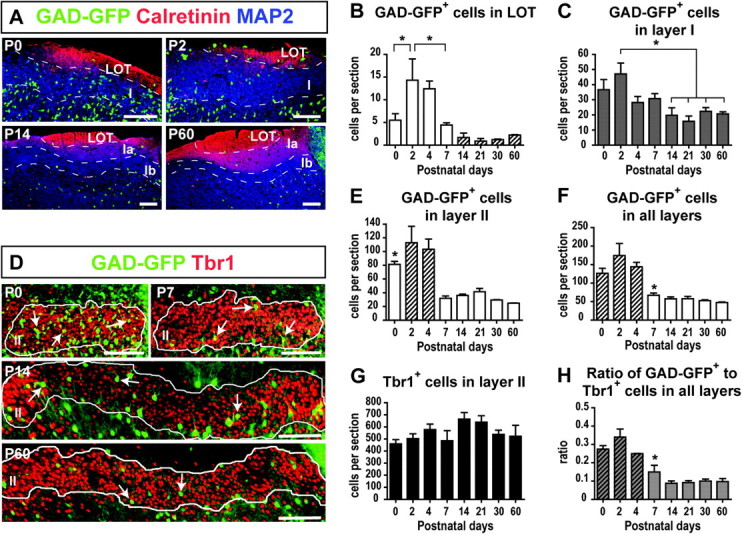
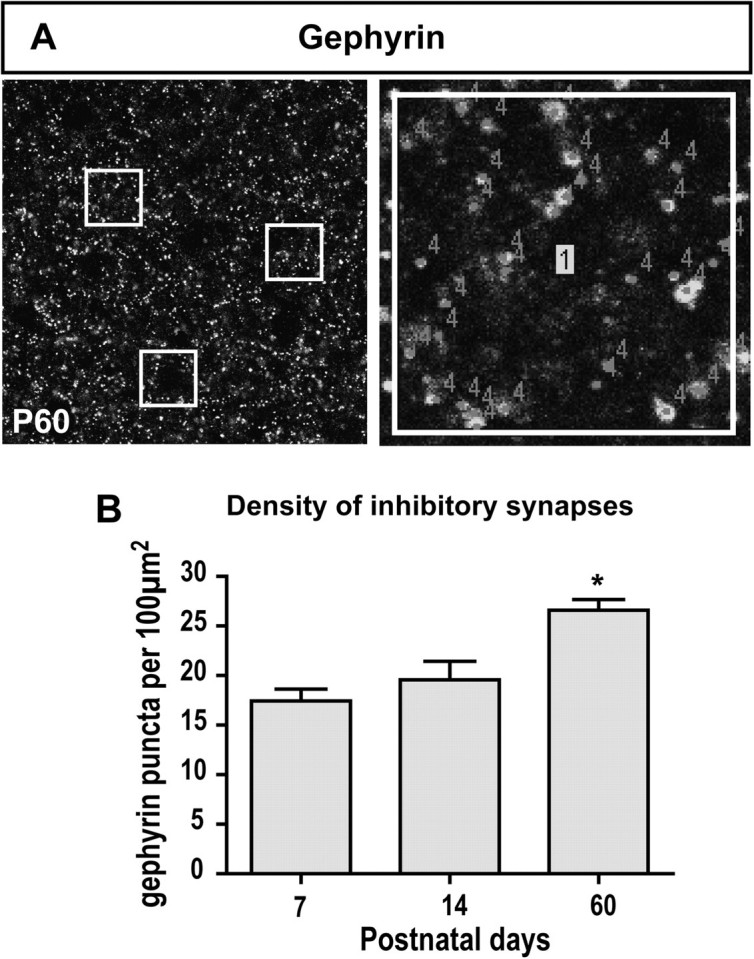
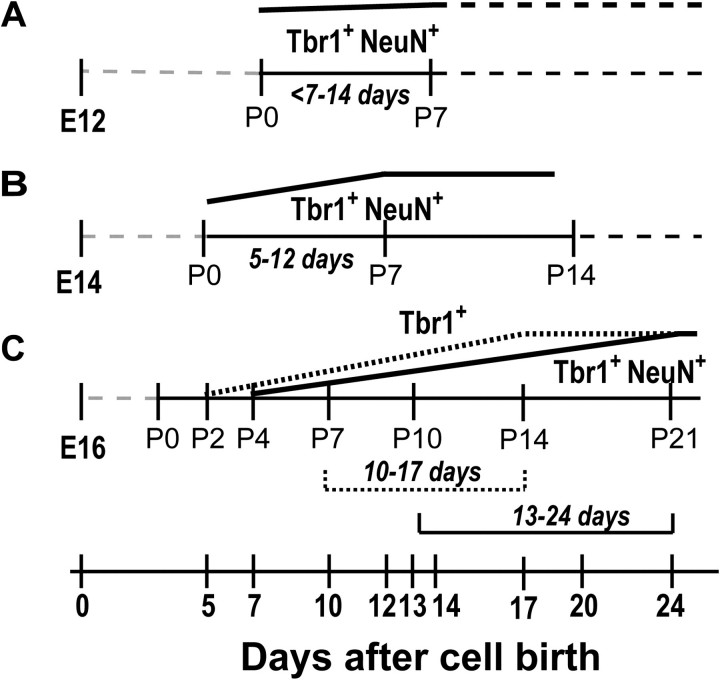
The piriform cortex (PCX) is a trilaminar paleocortex that is of interest for its role in odor coding and as a model for studying general principles of cortical sensory processing. While the structure of the mature PCX has been well characterized, its development is poorly understood. Notably, the kinetics as well as the cellular and morphological basis of the postnatal events that shape the PCX remain unknown. We followed the cellular fates of early- versus late-born cells in layer II of the anterior PCX, with a focus on the molecular maturation of pyramidal cells and the kinetics of their differentiation. We showed that: 1) early-born pyramidal cells differentiate more rapidly than late-born cells and 2) the position of pyramidal cells within the thickness of layer II determines the kinetics of their molecular maturation. We then examined the postnatal development of cortical lamination and showed that the establishment of inhibitory networks in the PCX proceeds through an increase in the density of inhibitory synapses despite a decrease in the number of interneurons. Together, our results provide a more comprehensive view of the postnatal development of the anterior PCX and reveal both similarities and differences in the development of this paleocortex versus the neocortex.


Figures

Figure 1.
Figure 1.
Early versus late-born cells in layer II. (A) BrdU-labeled cells in layer II (outlined) at P0. (B) Density of BrdU+ cells in layer II at P0 and P7. n = 3 animals per injection time point and per age. (C) Examples of the different cell subpopulations (BrdU+, BrdU+/NeuN+, BrdU+/Tbr1+, or BrdU+/Tbr1+/NeuN+) identified on an E12-injected P0 section. (D) Percent of BrdU-labeled pyramidal neurons (BrdU+/Tbr1+ or BrdU+/Tbr1+/NeuN+) at P7. (E) Percent of BrdU-labeled non-pyramidal neurons (BrdU+/NeuN+) at P7. (F) Percent of BrdU-labeled non-neuronal cells (BrdU+) at P7. Asterisks signify that E12 was significantly different from E14 and E16 in B (2-way ANOVA followed by Tukey’s post hoc tests) and that E16 was significantly different from E12 and E14 in (DF) (one-way ANOVA followed by Tukey’s post hoc tests). n = 5 animals per injection time point. **P < 0.01; ***P < 0.001. Scale bars = 100 μm in A, 20 μm in B.
Figure 2.
Figure 2.
Postnatal molecular differentiation of pyramidal cells. (A) Some pyramidal cells (arrows) expressed Tbr1 but not NeuN in layer II. (B) Decrease in the percentage of NeuN pyramidal cells during postnatal development. Asterisks (*) denote groups significantly different from P14–P60 while the pound (#) sign signifies a significant difference from P7 (one-way ANOVA followed by Tukey’s post hoc tests). (CD) Distribution of immature (Tbr1+NeuN) and mature (Tbr1+NeuN+) pyramidal cells within the thickness layer II at P0 (C) and P7 (D). Layer II was divided into 5 equally thick subregions (called bins), and bin n°1 represents the deepest part of layer II. (EF) Distribution of Tbr1+NeuN (E1 and F1) and Tbr1+NeuN+ (E2 and F2) pyramidal (Pyr) cells in the deep versus superficial halves of layer II at P0 (E) and P7 (F). n = 3 animals per age. *P < 0.05; **P < 0.01; ***P < 0.001; ###P < 0.001. Unpaired 2-tailed Student t-tests. Scale bar = 50μm.
Figure 3.
Figure 3.
Postnatal molecular differentiation of layer II pyramidal cells according to their birth-date. Postnatal changes in the percentages of E12- (A), E14- (B), and E16-born cells (C) classified as BrdU+ (A1, B1, C1), BrdU+/Tbr1+ (A2, B2, C2), or BrdU+/Tbr1+/NeuN+ (A3, B3, C3). Asterisks signify a significant difference between marked groups and P0 (A1–B3). Unpaired 2-tailed Student t-tests in (A) and one-way ANOVA followed by Tuckey’s post hoc tests in (B) and (C). (C1) Asterisks signify a significant difference between marked groups and P7–P21, while the pound sign denotes a significant difference between the marked group and P4. (C2) Asterisks signify that P7 was significantly different from P0–P4 and P14–P21. Not all significant post hoc tests are shown. (C3) Striped groups denote those that were significantly different from P14–P21 (P < 0.05) and asterisks signify a significant difference between the marked groups and P10. n = 3–5 animals per age for each injection time point. *P < 0.05; **P < 0.01; ***P < 0.001.
Figure 4.
Figure 4.
Pyramidal cell distribution in layer II based on birth-date. Distribution of E12- (A) and E14- (B) born pyramidal cells within the thickness of layer II at P7. Layer II was divided into 5 equally thick subregions (called bins) and bin n°1 represents the deepest portion of layer II. (CD) Distribution of E12- and E14-born pyramidal (Pyr) cells within the deep and superficial halves of layer II (unpaired 2-tailed Student t-tests): cell populations analyzed are all pyramidal cells (C1, D1), immature Tbr1+NeuN (C2, D2), and mature Tbr1+NeuN+ pyramidal cells (C3, D3). (E) Relative contribution of each birth-date (E12, E14, E16) to the population of immature Tbr1+NeuN pyramidal cells present at P7 (one-way ANOVA followed by Tuckey’s post hoc tests). n = 3 animals per injection time point. *P < 0.05; ***P < 0.001.
Figure 5.
Figure 5.
Postnatal differentiation of radial glia precursors. (A) Example of the 2 cell subpopulations (BrdU+/BLBP+ arrow and BrdU+/BLBP arrowhead) identified on an E16-injected P0 section. (B) Postnatal changes in the percentage of BrdU+/BLBP+ cells. Asterisks signify a significant difference between P0 and P2–P14 (one-way ANOVA followed by Tuckey’s post hoc tests). (C) Comparison of the percentage of the BrdU+/NeuN/Tbr1 and BrdU+/BLBP+ cell populations. Asterisks denote a significant difference between these 2 populations at P2 (2-way ANOVA followed by Tuckey’s post hoc tests). Scale bar = 50 μm. n = 3–5 animals per age. *P < 0.05; **P < 0.01.
Figure 6.
Figure 6.
Postnatal maturation of layer II interneurons. Postnatal changes in the percentages of E12- (A), E14- (B), and E16-born (C) BrdU+/NeuN+ cells. Asterisks signify a significant difference between the marked group and P0 (AB). Unpaired 2-tailed Student t-tests in A and one-way ANOVA followed by Tuckey’s post hoc tests in B and C. n = 3–5 animals per age. *P < 0.05; **P < 0.01.
Figure 7.
Figure 7.
Postnatal development of the laminar organization of the aPC. (A) Development of the laminar organization of the aPC from P0 to P60 visualized by immunostaining for Calretinin, MAP2, and DAPI. (B) Schematic of the method used to measure the thickness of each cortical layer using 3 lines perpendicular to the cortical surface. (C) Postnatal changes in the LOT thickness. The asterisks (*) denote groups significantly different from P0 and the pound sign (#) signifies a significant difference from P2 to P7. P60 (striped) was significantly different from all the other ages (P < 0.05). (D) Postnatal changes in the thickness of layer I. Striped groups highlight those significantly different from P0 and P2 (P < 0.01). (E) Postnatal changes in the thickness of layer Ia. The asterisk denotes a significant difference from P7 (P < 0.05). (F) Postnatal stability of the thickness of layer Ib. (G) Postnatal changes in the thickness of layer II. P30 and P60 (striped) were significantly different from P0 (P < 0.05). One-way ANOVA followed by Tuckey’s post hoc tests (CG). Scale bars = 100 μm in A and B. n = 3–4 animals per age. *P < 0.05.
Figure 8.
Figure 8.
Developmental distribution of interneurons in the aPC. (A) Postnatal development of the laminar distribution of GAD67-GFP+ cells in the LOT and layer I. (B) Number of GAD67-GFP+ cells in the LOT per section. Striped groups denote those significantly different from P2 and P4 (P < 0.05). (C) Number of GAD67-GFP+ cells in layer I per section. (D) GAD67-GFP+ interneurons (arrows) and Tbr1+ pyramidal cells in layer II (outlined) from P0 to P60. (E) Number of GAD67-GFP+ cells in layer II per section. The asterisk indicates that P0 was significantly different from P30 to P60. P2 and P4 (striped) were significantly different from P7 to P60 (P < 0.05). (F) Number of GAD67-GFP+ cells in all the aPC layers (LOT through layer II). Striped groups denote those significantly different from P14 to P60 (P < 0.05) and the asterisk signifies a significant difference from P2 to P4. (G) Number of Tbr1+ cells in layer II per section. (H) Ratio of GAD67-GFP+ interneurons to Tbr1+ cells in the entire aPC. Stripes denote groups significantly different from P14 to P60 (P < 0.01) and the asterisk denotes a significant difference from P0 to P2. Scale bars = 100 μm in A and D. n = 3 animals per age. One-way ANOVA followed by Tuckey’s post hoc tests in BC and EH. *P < 0.05.
Figure 9.
Figure 9.
Postnatal changes in inhibitory synapse density. (A) Inhibitory synapses in layer Ia were visualized by immunostaining for gephyrin (e.g., at P60). Three regions of interest were selected to count gephyrin-positive puncta. (B) Density of gephyrin-positive puncta (labeled “4”) in layer Ia per 100 μm2. Scale bars = 20 μm in A1, 2 μm in A2. n = 3–4 animals per age. One-way ANOVA followed by Tuckey’s post hoc tests. *P < 0.05.
Figure 10.
Figure 10.
Differential kinetics of pyramidal cell molecular differentiation based on cell birth-date. Schematic summarizing the onset of Tbr1 expression and coexpression of Tbr1 and NeuN by cells born at E12 (A), E14 (B), and E16 (C). Dashed gray lines represent the time period prior to the first analysis (P0), and black dashed lines represent presumed marker expression after the last point of analysis. The dotted line represents expression of Tbr1 only, while solid black lines represent coexpression of Tbr1 and NeuN. For each marker, the range of days represents the day at which approximately half of the pyramidal cells expressed the marker to the earliest point of maximal expression (e.g., 5–12 days for coexpression of Tbr1 and NeuN by E14-born cells).

Similar articles

Cited by

References

    1. Anderson SA, Eisenstat DD, Shi L, Rubenstein JL. Interneuron migration from basal forebrain to neocortex: dependence on Dlx genes. Science. 1997;278:474–476. - PubMed
    1. Ang ES, Jr., Haydar TF, Gluncic V, Rakic P. Four-dimensional migratory coordinates of GABAergic interneurons in the developing mouse cortex. J Neurosci. 2003;23:5805–5815. - PMC - PubMed
    1. Angevine JB, Jr., Sidman RL. Autoradiographic study of cell migration during histogenesis of cerebral cortex in the mouse. Nature. 1961;192:766–768. - PubMed
    1. Anthony TE, Klein C, Fishell G, Heintz N. Radial glia serve as neuronal progenitors in all regions of the central nervous system. Neuron. 2004;41:881–890. - PubMed
    1. Bayer SA. Neurogenesis in the rat primary olfactory cortex. Int J Dev Neurosci. 1986;4:251–271. - PubMed

Publication types

MeSH terms