

Language shift, bilingualism and the future of Britain's Celtic languages
- PMID: 21041210
- PMCID: PMC2981914
- DOI: 10.1098/rstb.2010.0051
Language shift, bilingualism and the future of Britain's Celtic languages
Abstract
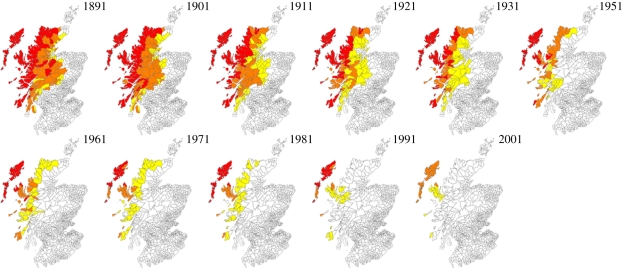
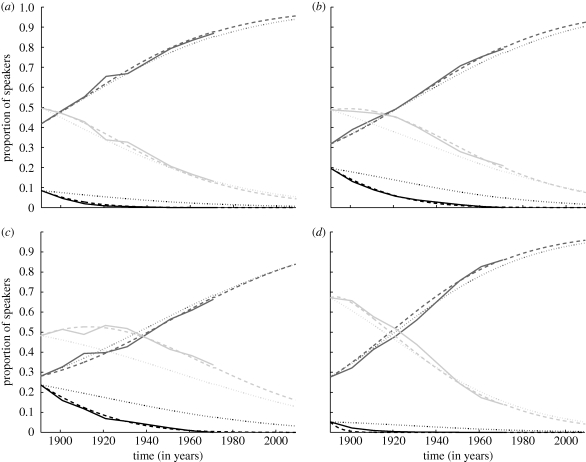
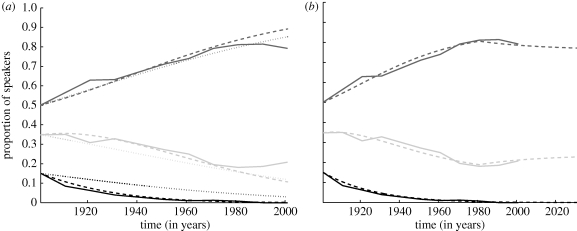
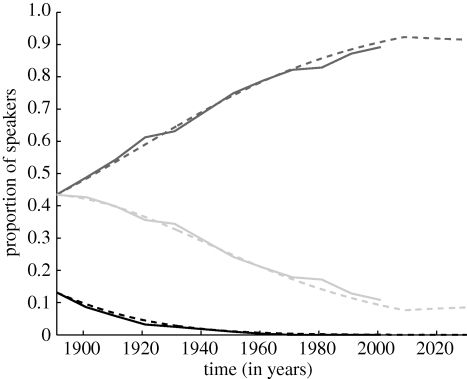
'Language shift' is the process whereby members of a community in which more than one language is spoken abandon their original vernacular language in favour of another. The historical shifts to English by Celtic language speakers of Britain and Ireland are particularly well-studied examples for which good census data exist for the most recent 100-120 years in many areas where Celtic languages were once the prevailing vernaculars. We model the dynamics of language shift as a competition process in which the numbers of speakers of each language (both monolingual and bilingual) vary as a function both of internal recruitment (as the net outcome of birth, death, immigration and emigration rates of native speakers), and of gains and losses owing to language shift. We examine two models: a basic model in which bilingualism is simply the transitional state for households moving between alternative monolingual states, and a diglossia model in which there is an additional demand for the endangered language as the preferred medium of communication in some restricted sociolinguistic domain, superimposed on the basic shift dynamics. Fitting our models to census data, we successfully reproduce the demographic trajectories of both languages over the past century. We estimate the rates of recruitment of new Scottish Gaelic speakers that would be required each year (for instance, through school education) to counteract the 'natural wastage' as households with one or more Gaelic speakers fail to transmit the language to the next generation informally, for different rates of loss during informal intergenerational transmission.
Figures
References
-
- Abrams D. M., Strogatz S. H.2003Modelling the dynamics of language death. Nature 424, 900 (doi:10.1038/424900a) - DOI - PubMed
-
- Aitchison J., Carter H.1985The Welsh language, 1961–1981: an interpretative atlas. Cardiff, UK: University of Wales Press
-
- Baggs I., Freedman H. I.1990A mathematical model for the dynamics of interactions between a unilingual and a bilingual population: persistence versus extinction. Math. Sociol. 16, 51–75 (doi:10.1080/0022250X.1990.9990078) - DOI
-
- Baggs I., Freedman H. I.1993Can the speakers of a dominated language survive as unilinguals? A mathematical model of bilingualism. Math. Comput. Model. 18, 9–18 (doi:10.1016/0895-7177(93)90122-F) - DOI
-
- Bowen I.1908The statutes of Wales. London, UK: T. Fisher
Publication types
MeSH terms
LinkOut - more resources
Full Text Sources
Miscellaneous