. 2010 Dec 31;285(53):41732-9.
doi: 10.1074/jbc.M110.153312. Epub 2010 Nov 1.

Agonist-induced localization of Gq-coupled receptors and G protein-gated inwardly rectifying K+ (GIRK) channels to caveolae determines receptor specificity of phosphatidylinositol 4,5-bisphosphate signaling

Affiliations

Agonist-induced localization of Gq-coupled receptors and G protein-gated inwardly rectifying K+ (GIRK) channels to caveolae determines receptor specificity of phosphatidylinositol 4,5-bisphosphate signaling

Shanyu Cui et al. J Biol Chem. .

Abstract

G protein-gated inwardly rectifying K(+) (GIRK) channels are parasympathetic effectors in cardiac myocytes that act as points of integration of signals from diverse pathways. Neurotransmitters and hormones acting on the Gq protein regulate GIRK channels by phosphatidylinositol 4,5-bisphosphate (PIP(2)) depletion. In previous studies, we found that endothelin-1, but not bradykinin, inhibited GIRK channels, even though both of them hydrolyze PIP(2) in cardiac myocytes, showing receptor specificity. The present study assessed whether the spatial organization of the PIP(2) signal into caveolar microdomains underlies the specificity of PIP(2)-mediated signaling. Using biochemical analysis, we examined the localization of GIRK and Gq protein-coupled receptors (GqPCRs) in mouse atrial myocytes. Agonist stimulation induced a transient co-localization of GIRK channels with endothelin receptors in the caveolae, excluding bradykinin receptors. Such redistribution was eliminated by caveolar disruption with methyl-β-cyclodextrin (MβCD). Patch clamp studies showed that the specific response of GIRK channels to GqPCR agonists was abolished by MβCD, indicating the functional significance of the caveolae-dependent spatial organization. To assess whether low PIP(2) mobility is essential for PIP(2)-mediated signaling, we blocked the cytoskeletal restriction of PIP(2) diffusion by latrunculin B. This abolished the GIRK channel regulation by GqPCRs without affecting their targeting to caveolae. These data suggest that without the hindered diffusion of PIP(2) from microdomains, PIP(2) loses its signaling efficacy. Taken together, these data suggest that specific targeting combined with restricted diffusion of PIP(2) allows the PIP(2) signal to be compartmentalized to the targets localized closely to the GqPCRs, enabling cells to discriminate between identical PIP(2) signaling that is triggered by different receptors.


Figures

FIGURE 1.
FIGURE 1.
Treatment with MβCD abolished the receptor-specific inhibition of IGIRK by GqPCR agonists. A, top, ACh (100 μm) induced K+ current (IGIRK) in mouse atrial cells. The second application of ACh was 4 min after washout of the first. Middle, ET-1 (30 nm) induced a profound inhibition of IGIRK. Bottom, BK (10 μm) did not affect IGIRK. B, histogram shows relative amplitudes (percent) of I2,qss with respect to I1,qss. *, p < 0.05 compared with ACh alone. Right, IGIRK during a first ACh stimulation (I1) and that during the second stimulation (I2) obtained from the experiment shown in A, are superimposed, showing the effect of the drugs on IGIRK. C, top, the second application of ACh was after 10-min treatment of MβCD. MβCD pretreatment did not affect IGIRK. Middle, MβCD pretreatment attenuated the effects of ET-1 on IGIRK. Bottom, MβCD pretreatment increased the effects of BK on IGIRK. D, data are summarized for I2,qss/I1,qss in cells pretreated with MβCD. *, p < 0.05, compared with ACh alone. Right, current traces obtained from the experiment shown in C are superimposed. Two representative traces for ET-1 or BK stimulated cells are shown.
FIGURE 2.
FIGURE 2.
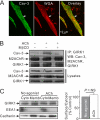
Caveolar targeting of activated GIRK channel in response to M2AChR stimulation. A, immunofluorescence images of atrial myocytes labeled with Cav-3 antibody (green) and WGA-Alexa Fluor 633 (red). Arrows indicate T-tubules. Scale bar, 10 μm. B, atrial tissue was treated with control buffer or with 100 μm ACh alone for 4 min or after 10-min pretreatment of 10 mm MβCD at 37 °C. Tissue lysates were immunoprecipitated (IP) with anti-GIRK1 antibody and then immunoblotted with anti-GIRK1, anti-Cav-3, or anti-M2AChR antibodies. C, cytoplasm and the membrane components of atrial myocytes were fractionated as described in under “Experimental Procedures,” and each fraction was confirmed by immunoblotting with antibodies against specific marker proteins; pan-cadherin for plasma membrane; EEA1 for early cytoplasmic endosome. Right, ratio of surface to intracellular localized GIRK channel was not significantly affected by ACh. Expression level of surface or cytosolic GIRK channels was normalized to the level of pan-cadherin or EEA1, respectively (n = 3). NS, not significant.
FIGURE 3.
FIGURE 3.
Agonist stimulation induces the association of GIRK channels and ETAR proteins with Cav-3 and the release of B2R from Cav-3. A, atrial tissue was treated with control buffer or with 30 nm ET-1 (upper) or 10 μm BK (lower) alone for 4 min or after 10-min pretreatment of 10 mm MβCD at 37 °C. Tissue lysates were immunoprecipitated with anti-ETAR (upper) or anti-B2R (lower) antibodies and then immunoblotted with anti-Cav-3 or anti-B2R antibodies. Histograms show the protein levels of Cav-3 associated with either ETAR or anti-B2R, respectively, under conditions indicated in the figure. The results shown are averages of three independent experiments, quantified by ImageJ. The results were also analyzed using Student's t test. B, atrial tissue was treated with control buffer or with a combination of ACh and ET-1 before and after pretreatment of MβCD at 37 °C, as indicated, was immunoprecipitated with anti-GIRK1, and then immunoblotted with anti-GIRK1 or anti-ETAR antibodies. The results shown were quantified by ImageJ and analyzed using Student's t test.
FIGURE 4.
FIGURE 4.
Effects of latrunculin B on GqPCR-induced GIRK channel regulation. A and B, after 30-min pretreatment of latrunculin B (10 μm), ET-1 effects were completely abolished (A). BK also had no effects on IGIRK (B). Inset, current traces in control (I1) and in the presence of each GqPCR agonist (I2) are superimposed to show the effect of the drugs on IGIRK. C, data of IGIRK inhibition by ET-1 and BK in control conditions and in cells loaded with latrunculin B (LA-B) are summarized. D, atrial tissue was treated with control buffer or ACh before and after 30-min preincubation of 10 μm latrunculin B at 37 °C, as indicated, and then was immunoprecipitated (IP) with anti-GIRK1 antibody and immunoblotted (WB) with anti-GIRK1 or anti-Cav-3 antibodies. E, atrial tissue was treated with control buffer or ET-1 before and after 30-min preincubation of 10 μm latrunculin B at 37 °C, as indicated, then immunoprecipitated with anti-ETAR and immunoblotted with anti-ETAR or anti-Cav-3 antibodies. In D and E, all four conditions were processed simultaneously.
FIGURE 5.
FIGURE 5.
Blocking PIP2 resynthesis pathway does not affect the sensitivity of GIRK channels to B2R. A, even in the presence of WMN (50 μm), BK effects on IGIRK were not affected, and current after washout of BK was completely recovered. B, effects of BK on IGIRK when the cells were incubated with 10 μm BAPTA-AM for 30 min are shown. Note that BK did not affect IGIRK. C, data of IGIRK inhibition by BK in various conditions are summarized. The numbers in parentheses indicate numbers of cells. Da, atrial myocytes were loaded with 5 μm Fluo-4 AM for Ca2+ measurements. Cells were treated with BK or thapsigargin as indicated by horizontal bars above the traces. BK does not affect [Ca2+]. Db, confocal image of control (a), after BK application, (b), and after thapsigargin treatment (c) in the Da are shown.
FIGURE 6.
FIGURE 6.
Schematic diagram of signaling microdomain for specific PIP2 signal. Stimulation of M2AChR/GIRK pathway and ETAR induce the recruitments of each component to Cav-3, which allow ETAR to interact with GIRK channels (upper). In contrast, B2R are dissociated from Cav-3 during B2R stimulation. By losing scaffolding network, they cannot interact with GIRK channel complexes any more (lower).

Similar articles

Cited by

References

    1. Chen P. S., Tan A. Y. (2007) Heart Rhythm 4, S61–S64 - PMC - PubMed
    1. Sharifov O. F., Fedorov V. V., Beloshapko G. G., Glukhov A. V., Yushmanova A. V., Rosenshtraukh L. V. (2004) J. Am. Coll. Cardiol. 43, 483–490 - PubMed
    1. Kolettis T. M., Kyriakides Z. S., Zygalaki E., Kyrzopoulos S., Kaklamanis L., Nikolaou N., Lianidou E. S., Kremastinos D. T. (2008) J. Interv. Card. Electrophysiol. 21, 203–208 - PubMed
    1. Tsai C. T., Lai L. P., Lin J. L., Chiang F. T., Hwang J. J., Ritchie M. D., Moore J. H., Hsu K. L., Tseng C. D., Liau C. S., Tseng Y. Z. (2004) Circulation 109, 1640–1646 - PubMed
    1. Kitakaze M., Node K., Takashima S., Minamino T., Kuzuya T., Hori M. (2000) Hypertens. Res. 23, 253–259 - PubMed

Publication types

MeSH terms

Substances