. 2011 Jan 7;286(1):766-76.
doi: 10.1074/jbc.M110.164970. Epub 2010 Nov 1.

Identification and functional characterization of TMEM16A, a Ca2+-activated Cl- channel activated by extracellular nucleotides, in biliary epithelium

Affiliations

Identification and functional characterization of TMEM16A, a Ca2+-activated Cl- channel activated by extracellular nucleotides, in biliary epithelium

Amal K Dutta et al. J Biol Chem. .

Abstract

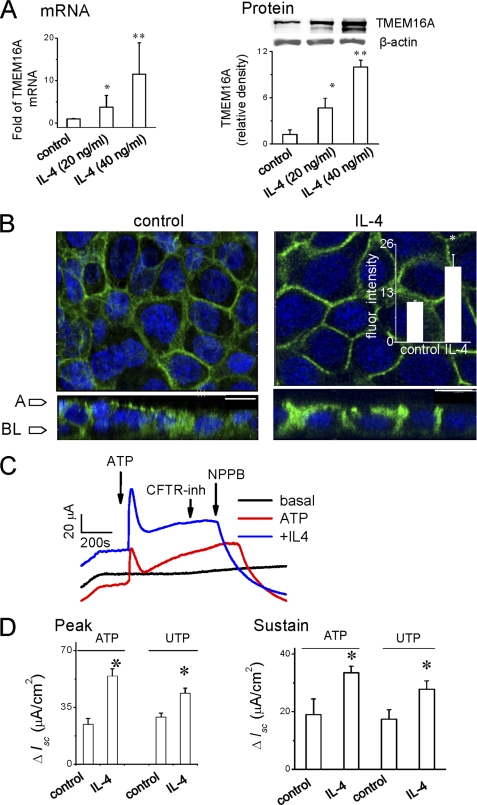
Cl(-) channels in the apical membrane of biliary epithelial cells (BECs) provide the driving force for ductular bile formation. Although a cystic fibrosis transmembrane conductance regulator has been identified in BECs and contributes to secretion via secretin binding basolateral receptors and increasing [cAMP](i), an alternate Cl(-) secretory pathway has been identified that is activated via nucleotides (ATP, UTP) binding apical P2 receptors and increasing [Ca(2+)](i). The molecular identity of this Ca(2+)-activated Cl(-) channel is unknown. The present studies in human, mouse, and rat BECs provide evidence that TMEM16A is the operative channel and contributes to Ca(2+)-activated Cl(-) secretion in response to extracellular nucleotides. Furthermore, Cl(-) currents measured from BECs isolated from distinct areas of intrahepatic bile ducts revealed important functional differences. Large BECs, but not small BECs, exhibit cAMP-stimulated Cl(-) currents. However, both large and small BECs express TMEM16A and exhibit Ca(2+)-activated Cl(-) efflux in response to extracellular nucleotides. Incubation of polarized BEC monolayers with IL-4 increased TMEM16A protein expression, membrane localization, and transepithelial secretion (I(sc)). These studies represent the first molecular identification of an alternate, noncystic fibrosis transmembrane conductance regulator, Cl(-) channel in BECs and suggest that TMEM16A may be a potential target to modulate bile formation in the treatment of cholestatic liver disorders.


Figures

FIGURE 1.
FIGURE 1.
Expression and localization of TMEM16A in human Mz-Cha-1 cells, MSCs and MLCs, NRC monolayers, and mouse and rat whole liver. A, RT-PCR. Species-specific TMEM16A primers were used to detect TMEM16A expression in all models represented by a band size at ∼305 bp for human and ∼300 bp for mouse and rat (as described under “Experimental Procedures”). TMEM16 b, j, f, and k isoforms were also evaluated. A λ DNA-HindIII digest ladder was used to delineate the size of respective amplicons. B, Western blot utilizing polyclonal anti-TMEM16A antibody (as described under “Experimental Procedures”). TMEM16A protein (band at ∼114 kDa) is present in whole-cell lysates of Mz-Cha-1, MLC, MSC, and NRC cells; the loading control was β-actin. C, membrane localization of TMEM16A protein in polarized NRC monolayers. Staining with anti-TMEM16A antibody (green) demonstrates TMEM16A protein in both apical and basolateral membranes with predominance in apical compartments. Cell nuclei were counterlabeled with DAPI (blue). The lower panel represents the Z-axis view; arrows: A, apical; BL, basolateral membrane (scale bar, 10 μm). D, localization of TMEM16A in whole liver sections of BDL mice (top) and rat (bottom). TMEM16A (green) co-localizes with cholangiocyte markers CK19 (rat) and CK7 (mouse). Cell nuclei stained with DAPI (blue). The rat bile duct is outlined by a dotted line (top right panel). Scale bar, 10 μm.
FIGURE 2.
FIGURE 2.
Ca2+-activated Cl currents in human Mz-Cha-1 cells are mediated via TMEM16A. A and B, representative whole-cell recordings. Currents were measured during basal conditions and during exposure to ionomycin (2 μm; A) or ATP (100 μm; B). Currents measured at −80 mV (open circles), representing ICl, and at 0 mV (closed circles), representing IK+, are shown. Voltage protocols shown in the inset. Maximum current for this study are indicated by black dots immediately below the trace. A voltage-step protocol (from a holding potential of −40 mV, 100-ms steps from −100 to +100 mV in 20-mV increments) was obtained at a(star) (basal), b(star) (maximal outward current response), and c(star) (maximal inward current response) as indicated. The I-V plots were generated from these protocols and shows the current-voltage relation during basal (●), ionomycin-, or ATP-stimulated conditions (maximal outward currents (K+) are represented by ▿, and maximal inward currents (Cl) are represented by ○. C, representative Western blot and cumulative data demonstrating change in TMEM16A protein and mRNA levels in control cells, cells transfected with nontargeting siRNA (mock), and cells transfected with anti-TMEM16A siRNA (*, p < 0.05 versus control or mock levels). D and E, representative whole-cell recordings from cells transfected with anti-TMEM16A siRNA in response to ionomycin (2 μm; D) or ATP (100 μm; E). Voltage-step protocols were obtained at indicated points (a(star) and b(star)), shown below the trace, and plotted as an I-V relation (inset). F, cumulative data demonstrating maximal current density (−pA/pF) measured at −80 mV in response to ionomycin, ATP, and UTP (100 μm) in cells transfected with nontargeting siRNA (mock) or cells transfected with anti-TMEM16A siRNA (bars represent mean ± S.E.; n = 6 for ionomycin; n = 14 for ATP; n = 7 for UTP). *, p < 0.05 versus mock-transfected.
FIGURE 3.
FIGURE 3.
Representative whole cell recordings from single MLC (A) and MSC (B) measured at −80 mV representing ICl. Exposure to cAMP mixture (10 μm forskolin, 100 μm isobutylmethylxanthine, and 500 μm cpt-cAMP), ATP (100 μm), and CFTRinh172 (5 μm) is indicated by the bar. The voltage-step protocol (100-ms steps from −100 to +100 mV in 20-mV increments) was obtained at a(star), b(star), and c(star) as indicated and used to generate the I-V relation during cAMP mixture (●) and ATP-stimulated (○) conditions. C, left panel, maximum current density (−pA/pF) measured at −80 mV in response to cAMP mixture or ATP in MLC (n = 6) or MSC (n = 5). *, current density in response to ATP was significantly greater than cAMP mixture (p < 0.05). **, current density in response to cAMP mixture was significantly greater in MLC versus MSC (p < 0.05). #, current density in response to cAMP mixture was significantly inhibited by CFTRinh172 (p < 0.05). The right panel shows quantitative levels of TMEM16A mRNA by real-time PCR (p = not significant between MLC and MSC).
FIGURE 4.
FIGURE 4.
Characterization of ATP-stimulated Cl currents in MSC. A, whole-cell currents were measured at −80 mV during basal conditions and during exposure to ATP (100 μm) (upper trace). A voltage-step protocol was obtained at a(star) (basal) and b(star) (maximal current response) as indicated (shown below the trace) and plotted as the I-V relation during basal (●) and ATP-stimulated (○) conditions. Middle plots show ATP-stimulated currents in the presence (bars below trace) or absence of the Cl channel inhibitors NPPB (100 μm) or niflumic acid (100 μm). B, cumulative data demonstrating maximum current density (−pA/pF) measured at −80 mV (n = 4–9 each). *, NPPB and niflumic acid significantly blocked ATP-stimulated currents (p < 0.05 versus control for each). C, representative whole-cell current recording in response to ATP (100 μm) from MSC cells transfected with nontargeting siRNA (control-mock, top panel) or siRNA against TMEM16A (bottom panel). Voltage-step protocols obtained at a(star) (basal) and b(star) (maximal current response) as indicated. The I-V plots shown were generated from these protocols and demonstrate basal (●) and ATP-stimulated (○) conditions. Right panel, effect of anti-TMEM16A siRNA on protein expression, representative Western blot (top), and cumulative data (bottom). D, cumulative data demonstrating maximum current density (−pA/pF) measured at −80 mV in response to ATP (100 μm, n = 4), or UTP (100 μm, n = 4) in MSCs transfected with nontargeting siRNA (mock) or anti-TMEM16A siRNA. *, p < 0.05 versus mock transfection.
FIGURE 5.
FIGURE 5.
Biophysical properties of whole-cell Ca2+-activated Cl currents in mouse cholangiocytes. A, representative whole-cell currents (utilizing voltage-step protocol; see “Experimental Procedures”) recorded from MLC cells in response to increasing [Ca2+]i in pipette solution and corresponding I-V relation plotted on the right. B, [Ca2+]i dose-response curve for Cl currents. Data were plotted from maximum current density (pA/pF) measured at −80 mV in response to different intracellular (pipette) Ca2+ concentrations. Each point represents mean ± S.E. (n = 3–5 each) fit to the Hill equation (see “Experimental Procedures”). C, anti-TMEM16A siRNA inhibits Ca2+-activated Cl currents. Representative spontaneous whole-cell currents, measured at −80 mV, in response to 1 μm free Ca2+ in pipette solution from MLC cells transfected with nontargeting siRNA (mock, ○) or anti-TMEM16A siRNA (●). D, (cumulative data) values represent maximum current density measured at −80 mV in response to 1 μm free Ca2+ in pipette (n = 6–7 each). *, p < 0.05 versus mock.
FIGURE 6.
FIGURE 6.
TMEM16A contributes to transepithelial secretion in polarized cholangiocyte monolayers. Short circuit current (Isc) across NRC monolayers was measured under voltage clamp conditions in an Ussing chamber. In these studies, agonists were added to the apical chamber. A, representative recording. Addition of ATP (200 μm) increased Isc, which was unaffected by CFTRinh172 (5 μm) but inhibited by NPPB (100 μm). B, cumulative data representing change in Isc in response to the addition of ATP in the presence or absence of the Cl channel inhibitors. The y axis values are reported as ΔIsc (maximum Isc − basal Isc). *, NPPB and niflumic acid (n. acid) significantly inhibited the ATP-stimulated Isc (p < 0.05, n = 3 each). C, representative recordings of short circuit current Isc stimulated by UTP (100 μm) in control NRC (black) or NRC-transfected with anti-TMEM16A siRNA (blue). Anti-TMEM16A siRNA significantly decreased TMEM16A mRNA expression (inset). D, average change in Isc after addition of UTP or ATP in control NRC (mock) or NRC transfected with anti-TMEM16A siRNA. The y axis values are reported as ΔIsc (maximum Isc − basal Isc). *, p < 0.05 versus mock transfected, n = 5–6 each.
FIGURE 7.
FIGURE 7.
IL-4 increases TMEM16A expression and transepithelial secretion in polarized NRC monolayers. A, TMEM16A mRNA and protein levels assessed by real-time PCR (left) and Western blot (right), respectively, with or without overnight treatment with IL-4 (20 or 40 ng/ml). Representative Western blot is shown in the inset; β-actin was used as the loading control. *, p < 0.05 versus control monolayers (without IL-4, n = 3 each). **, p < 0.05 versus control monolayers (n = 3–4 each). B, localization of TMEM16A protein in NRC monolayers. Labeling with anti-TMEM16A antibody (green) demonstrates presence of TMEM16A protein on cell membrane with predominant apical location (left panel). Nuclei were counterlabeled with DAPI (blue). Overnight treatment with IL-4 (40 ng/ml) increased membrane expression of TMEM16A. The inset shows the relative increase in green (TMEM16A) fluorescence intensity in IL-4 treated cells versus control (n = 31–36, p < 0.01). The Z-axis views are shown below panels; arrows: A, apical; BL, basolateral membrane (scale bar, 10 μm). C, representative short circuit current Isc measurements under basal (nonstimulated) conditions (black) and in response to ATP (200 μm) in control NRC (red) and after overnight treatment with IL-4 (10 ng/ml) (blue). In these representative recordings, agonists were added to the apical chamber at the indicated time points. D, average change in Isc in response to ATP or UTP in control (nontreated) and IL-4-treated monolayers. The y axis values are reported as ΔIsc (maximum Isc − basal Isc). The left panel shows peak currents, and the right panel shows sustained currents. *, IL-4 significantly increased Isc both at peak and sustained level versus control (without IL-4) monolayers (n = 6–12 each, p < 0.05).

Similar articles

Cited by

References

    1. Kumar U., Jordan T. W. (1986) Liver 6, 369–378 - PubMed
    1. Preisig R., Cooper H. L., Wheeler H. O. (1962) J. Clin. Invest. 41, 1152–1162 - PMC - PubMed
    1. Wheeler H. O., Ramos O. L. (1960) J. Clin. Invest. 39, 161–170 - PMC - PubMed
    1. Fitz J. G. (2002) Semin. Liver Dis. 22, 241–249 - PubMed
    1. Fitz J. G., Basavappa S., McGill J., Melhus O., Cohn J. A. (1993) J. Clin. Invest. 91, 319–328 - PMC - PubMed

Publication types

MeSH terms