. 2010 Dec 31;285(53):41863-73.
doi: 10.1074/jbc.M110.183723. Epub 2010 Nov 1.

A noncompetitive small molecule inhibitor of estrogen-regulated gene expression and breast cancer cell growth that enhances proteasome-dependent degradation of estrogen receptor {alpha}

Affiliations

A noncompetitive small molecule inhibitor of estrogen-regulated gene expression and breast cancer cell growth that enhances proteasome-dependent degradation of estrogen receptor {alpha}

Nicole M Kretzer et al. J Biol Chem. .

Abstract

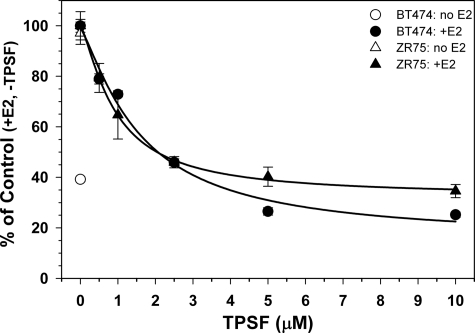
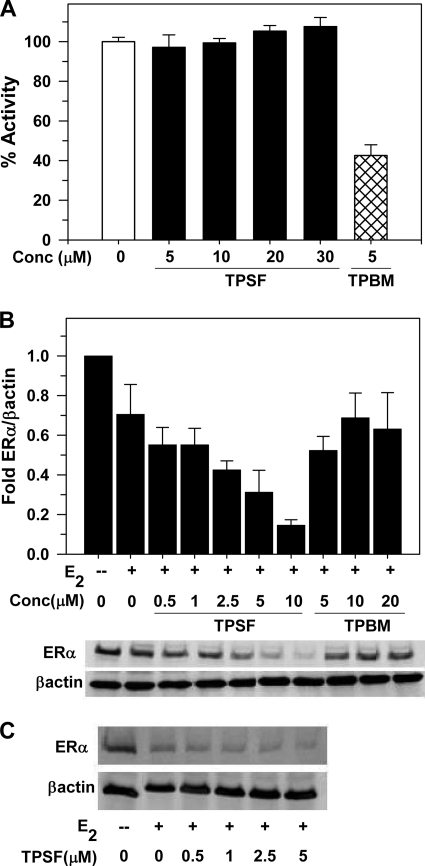
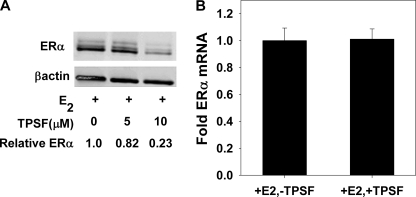
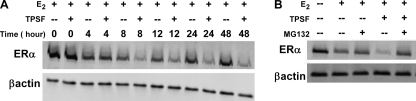
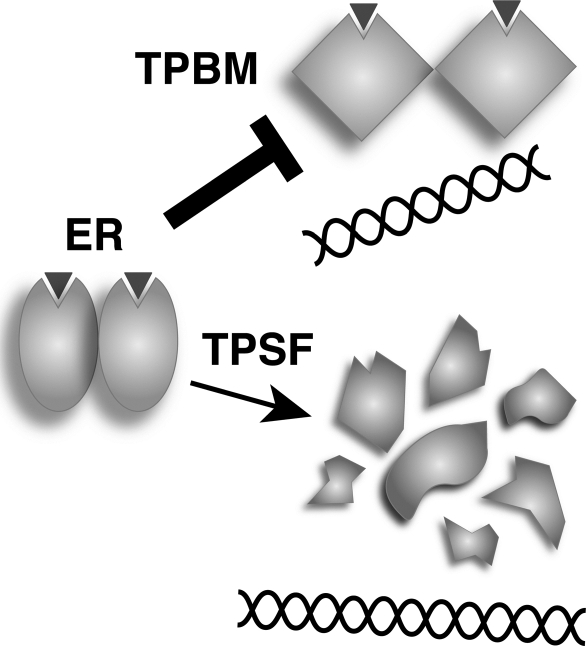
The mechanisms responsible for 17β-estradiol (E(2))-stimulated breast cancer growth and development of resistance to tamoxifen and other estrogen receptor α (ERα) antagonists are not fully understood. We describe a new tool for dissecting ERα action in breast cancer, p-fluoro-4-(1,2,3,6,-tetrahydro-1,3-dimethyl-2-oxo-6-thionpurin-8-ylthio) (TPSF), a potent small-molecule inhibitor of estrogen receptor α that does not compete with estrogen for binding to ERα. TPSF noncompetitively inhibits estrogen-dependent ERα-mediated gene expression with little inhibition of transcriptional activity by NF-κB or the androgen or glucocorticoid receptor. TPSF inhibits E(2)-ERα-mediated induction of the proteinase inhibitor 9 gene, which is activated by ERα binding to estrogen response element DNA, and the cyclin D1 gene, which is induced by tethering ERα to other DNA-bound proteins. TPSF inhibits anchorage-dependent and anchorage-independent E(2)-ERα-stimulated growth of MCF-7 cells but does not inhibit growth of ER-negative MDA-MB-231 breast cancer cells. TPSF also inhibits ERα-dependent growth in three cellular models for tamoxifen resistance; that is, 4-hydroxytamoxifen-stimulated MCF7ERαHA cells that overexpress ERα, fully tamoxifen-resistant BT474 cells that have amplified HER-2 and AIB1, and partially tamoxifen-resistant ZR-75 cells. TPSF reduces ERα protein levels in MCF-7 cells and several other cell lines without altering ERα mRNA levels. The proteasome inhibitor MG132 abolished down-regulation of ERα by TPSF. Thus, TPSF affects receptor levels at least in part due to its ability to enhance proteasome-dependent degradation of ERα. TPSF represents a novel class of ER inhibitor with significant clinical potential.


Figures

FIGURE 1.
FIGURE 1.
Structure-specific inhibition of E2-ERα-mediated gene expression by TPSF. A, shown are structures of three ERα inhibitors. TPBM is a recently described ERα inhibitor (19). TPSF is butyrophenone, p-fluoro-4-(1,2,3,6,-tetrahydro-1,3-dimethyl-2-oxo-6-thionpurin-8-ylthio and is known also as theophylline, 8-(3-p-fluorobenzoylpropyl)thio-6-thio-). NSC-99676 is similar to TPSF except TPSF has Cformula image
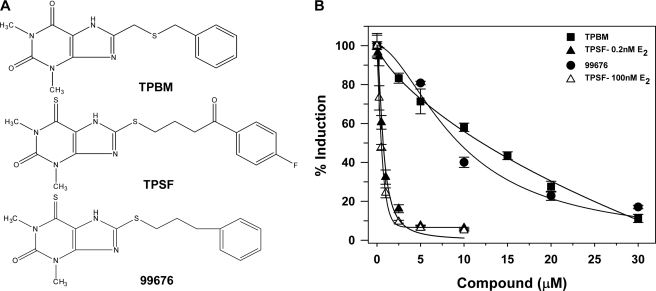
O and fluorine substitutions at the phenyl ring. B, shown are potency and efficacy of TPSF (triangles), TPBM (squares), and 99676 (circles). Inhibition of E2-ERα activation of ERE-Luc was evaluated in dose-response studies of T47D (ERE)3-Luc cells maintained in 0.2 nm E2 (filled triangles, squares, and circles) or 100 nm E2 (open triangles) with the indicated concentrations of TPBM, TPSF, or 99676 present for 24 h before assay. Activity of the reporter in the presence of the tested concentration of E2 with DMSO and no inhibitor was set to 100%. Data are the average of three experiments ± S.E. Some symbols overlap, and some error bars are smaller than the symbols. IC50 values were calculated by curve fitting using Sigma Plot.
FIGURE 2.
FIGURE 2.
TPSF specifically inhibits expression of endogenous ER-regulated genes. A, TPSF inhibits E2 induction of PI-9 mRNA. For studies of PI-9 mRNA (filled squares), MCF-7 cells were incubated for 24 h with the indicated concentrations of TPSF and maintained for 4 h in 10 nm E2 and TPSF. PI-9 mRNA was quantitated by RT-PCR as described (23). B, TPSF inhibition of E2-ERα induction of cyclin D1 mRNA is shown. MCF-7 cells were plated and 24 h later treated with ethanol and DMSO vehicles, 10 nm E2, or 10 nm E2 and 10 μm TPSF. After 24 h, RNA was extracted, and cyclin D1 mRNA levels were measured by qRT-PCR. The level of cyclin D1 mRNA in the vehicle only sample was set to 1. -Fold induction of cyclin D1 in the presence of 10 μm TPSF was significantly different from the control (p < 0.05 using Student's t test). C, TPSF does not inhibit NF-κB induction of IL-8 mRNA. MCF-7 cells were maintained for 24 h in medium without TNF-α or with 10 ng/ml TNF-α with and without 30 μm TPSF and harvested, and IL-8 mRNA levels were determined by qRT-PCR. D, dose-response studies of inhibition of ERα, AR, and GR transactivation are shown. For each receptor, induction of luciferase reporter gene expression (AR and GR) or endogenous PI-9 mRNA (ER) in the presence of an appropriate ligand with DMSO minus TPSF was set to 100%. Cells were incubated for 24 h with 0.2 nm E2 for ERα (filled squares), 5 nm dexamethasone for GR (filled triangles), 1 μm dihydrotestosterone for AR (filled circles), and the indicated concentrations of TPSF. Data are the average ± S.E. for three experiments.
FIGURE 3.
FIGURE 3.
TPSF inhibits E2 and OHT-induced gene expression in a tamoxifen-stimulated cell line. A and B, MCF7ERαHA cells maintained in 6× CD-FBS (22, 37) were treated for 24 h with 0.5 μg/ml Dox to induce ERα expression (37) and 100 pm E2 and 10 μm TPSF (A) or 500 pm OHT and 10 μm TPSF (B) as indicated. PI-9 mRNA levels were measured by qRT-PCR. PI-9 mRNA in control MCF7ERαHA cells not treated with Dox, E2, or OHT was set equal to 1. The high level of ERα in Dox-treated cells results in ligand-independent transactivation of PI-9 (23). Data are the average, with the range shown, for two experiments for E2 and three experiments ± S.E. for OHT.
FIGURE 4.
FIGURE 4.
Inhibition of E2-ERα-dependent breast cancer cell growth by TPSF. MCF-7 and MDA-MB-231 cells were maintained for 4 days in 5% CD-CS, and 1000 MCF-7 cells (circles) or MDA-MB-231 cells (triangles) were plated per well in 96-wellplates. After 24 h the medium was changed to 5% CD-CS with 1 pm E2 (filled circles or triangles) or without E2 (open circle and open triangle) and DMSO vehicle and the indicated concentrations of TPSF. Medium was replaced after 2 days, and cells were assayed with MTS after a total of 4 days. Cell number was determined using a standard curve of cell number versus absorbance based on plating a known number of cells and assaying using MTS. Each data point is the average of 8 wells ± S.E. The percentage of cells present after 4 days with E2 and without TPSF was set equal to 100. By curve-fitting in Sigma Plot, the IC50 for inhibition of E2-dependent growth of MCF-7 cells by TPSF was 2 μm.
FIGURE 5.
FIGURE 5.
TPSF inhibits growth of MCF-7 cells in soft agar. 5000 MCF-7 cells were plated into top agar containing 1 pm E2 (left) or E2 + 10 μm TPSF (right) as described under “Experimental Procedures.” After 16 days colonies were photographed at 5× magnification and counted. Photographs are representative of the entire plate and of duplicate experiments.
FIGURE 6.
FIGURE 6.
TPSF inhibits E2-ERα-dependent growth of tamoxifen-resistant BT474 and ZR-75 cells. Cells were maintained in medium containing 10% CD-FBS (ZR-75) (triangles) or 10% CD-CS (BT474) (circles) with or without 100 pm E2 and the indicated concentrations of TPSF. Viable cells were measured by comparison to a standard curve of cell number versus absorbance using the MTS assay. Data represent the average of at least 4 wells. IC50 values for TPSF inhibition of cell growth were calculated by curve-fitting using Sigma Plot. Although some portion of ZR-75 cell growth is likely ERα-independent, to calculate the IC50 using Sigma Plot, we used the conservative assumption that all cell growth beyond the 2000 ZR-75 cells plated was E2-ERα-dependent growth and, thus, subject to inhibition by TPSF.
FIGURE 7.
FIGURE 7.
Different modes of action of TPSF and TPBM. A, TPSF does not inhibit binding of E2-ERα to the flcERE. Fluorescence anisotropy microplate assay was performed as described (19) in the presence of increasing concentrations of TPSF (solid bars) and 5 μm TPBM (hatched bar). Consistent with our detailed dose-response study (19), 5 μm TPBM inhibited binding of TPBM to the flcERE by ∼60%. Data were plotted with the change in anisotropy for binding of E2-ERα to the flcERE in the absence of small molecule inhibitors (open bar) set to 100% (actual anisotropy: flcERE, 44 mA units; E2-ERα-flcERE, 81 mA units). Data are the average + S.E. of four experiments. The difference between 5 μm TPSF and the control (no inhibitor) was not significant (p > 0.05). The data for 5 μm TPBM were significantly different from both the control and from 5 μm TPSF (p < 0.01 using Student's t test) B, TPSF decreases ERα levels. MCF-7 cells were cultured in 5% CD calf serum for at least 2 days and maintained in the absence or presence of E2 and the indicated concentrations of TPSF or TPBM for 24 h and analyzed for ERα by Western blot using 8 μg of protein/lane with actin as internal standard. Data are from the Western blot shown and two additional Western blots from independent experiments and are presented as the mean ± S.E. Quantitation of ERα and actin was by PhosphorImager analysis. The value for ERα/actin in the absence of E2 was set equal to 1. C, T47D cells were maintained as described under “Experimental Procedures,” maintained in the absence or presence of E2 and the indicated concentrations of TPSF, harvested, and analyzed by Western blot as described for panel B.
FIGURE 8.
FIGURE 8.
TPSF does not alter the level of ERα mRNA. A, shown is a Western blot of HeLa-ER cell extract. HeLa cells stably transfected to express functional wild-type ERα (76) were maintained in MEM + 10% FBS. Four days before, the cells were plated in 6-well plates at 50,000 cells/well in MEM + 10% 1× CD-FBS. The medium was changed after 2 days and on day 4 replaced with fresh medium containing 10 nm E2 in DMSO or DMSO and the indicated concentration of TPSF. After 24 h, the cells were harvested, and extracts were prepared as described under “Experimental Procedures.” B, effect of TPSF on ERα mRNA levels in MCF-7 cells. Cells were maintained 4 days in MEM + 5% 1× CD-FBS as described under “Experimental Procedures.” Then cells were then maintained for 24 h in medium containing 10 nm E2 in DMSO or DMSO with or without 10 μm TPSF and ER mRNA levels determined by qRT-PCR as described under “Experimental Procedures.” Data were the average of three experiments ±S.E.
FIGURE 9.
FIGURE 9.
The proteasome inhibitor MG132 blocks degradation of ERα by TPSF. A, shown is the time course of the effect of TPSF on ER levels. MCF-7 cells were plated as described under “Experimental Procedures.” After 4 days in MEM + 5% 1× CD-FBS, the medium was replaced with medium containing 10 nm E2 with or without 10 μm TPSF. Cells were harvested at the indicated times, extracts prepared, and ERα protein levels were determined by Western blot as described under “Experimental Procedures.” B, MG132 reverses the down-regulation of ER by TPSF. Cells were treated as in panel A and maintained for 24 h in medium containing 10 nm E2 with or without 10 μm and 10 μm MG132. Preparation of cell extracts and Western blotting were as described under “Experimental Procedures.”
FIGURE 10.
FIGURE 10.
Schematic representation of the different modes of action of TPSF and TPBM.

Similar articles

Cited by

References

    1. O'Lone R., Frith M. C., Karlsson E. K., Hansen U. (2004) Mol. Endocrinol. 18, 1859–1875 - PubMed
    1. Carroll J. S., Brown M. (2006) Mol. Endocrinol. 20, 1707–1714 - PubMed
    1. Carroll J. S., Liu X. S., Brodsky A. S., Li W., Meyer C. A., Szary A. J., Eeckhoute J., Shao W., Hestermann E. V., Geistlinger T. R., Fox E. A., Silver P. A., Brown M. (2005) Cell 122, 33–43 - PubMed
    1. Jakacka M., Ito M., Weiss J., Chien P. Y., Gehm B. D., Jameson J. L. (2001) J. Biol. Chem. 276, 13615–13621 - PubMed
    1. Safe S. (2001) Vitam. Horm. 62, 231–252 - PubMed

Publication types

MeSH terms