. 2010 Dec;137(23):3965-71.
doi: 10.1242/dev.055970. Epub 2010 Nov 1.

Identification of epidermal progenitors for the Merkel cell lineage

Affiliations

Identification of epidermal progenitors for the Merkel cell lineage

Seung-Hyun Woo et al. Development. 2010 Dec.

Erratum in

  • Development. 2012 Feb 1;139(3):622

Abstract

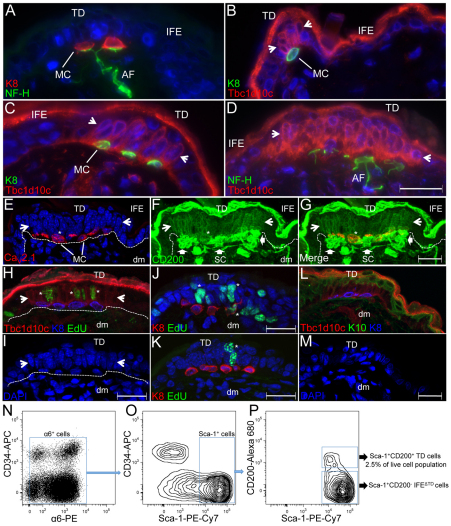
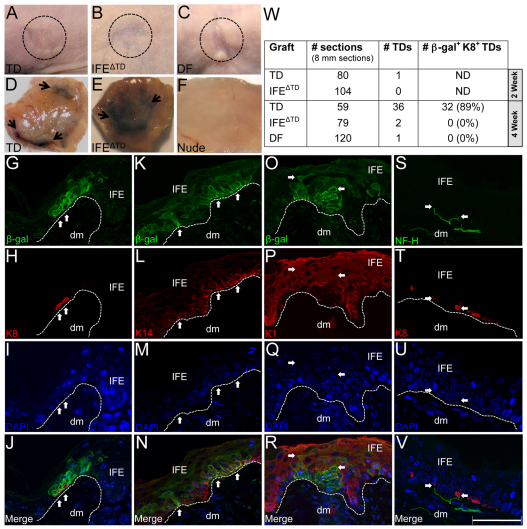
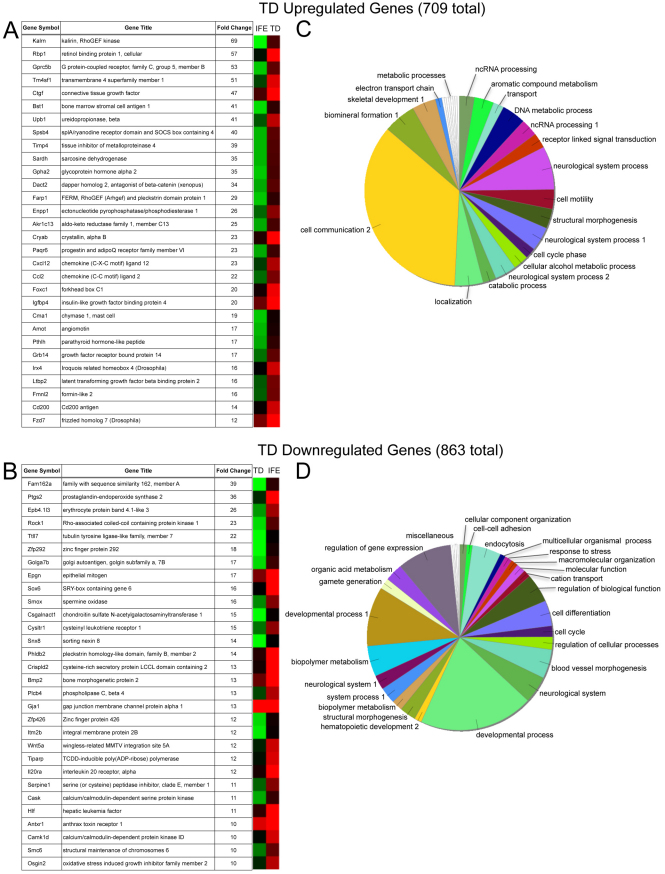
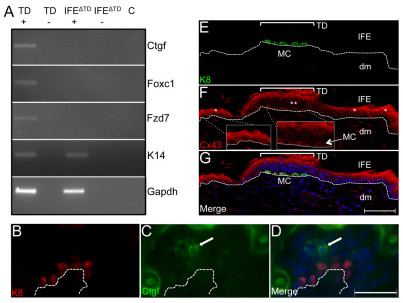
Epithelial stem cells in adult mammalian skin are known to maintain epidermal, follicular and sebaceous lineages during homeostasis. Recently, Merkel cell mechanoreceptors were identified as a fourth lineage derived from the proliferative layer of murine skin epithelium; however, the location of the stem or progenitor population for Merkel cells remains unknown. Here, we have identified a previously undescribed population of epidermal progenitors that reside in the touch domes of hairy skin, termed touch dome progenitor cells (TDPCs). TDPCs are epithelial keratinocytes and are distinguished by their unique co-expression of α6 integrin, Sca1 and CD200 surface proteins. TDPCs exhibit bipotent progenitor behavior as they give rise to both squamous and neuroendocrine epidermal lineages, whereas the remainder of the α6(+) Sca1(+) CD200(-) epidermis does not give rise to Merkel cells. Finally, TDPCs possess a unique transcript profile that appears to be enforced by the juxtaposition of TDPCs with Merkel cells within the touch dome niche.


Figures

Fig. 1.
Fig. 1.
Immunofluorescence labeling and FACS detection of touch domes (TDs). (A-M) K8 (A-C,J-L), NF-H (A,D), Tbc1d10c (B-D,H,L), CaV2.1 (E,G), CD200 (F,G), EdU (H,J,K) and K10 (L) fluorescence labeling in mouse skin sections. Asterisks designate EdU+ basal columnar (H) and suprabasal (J,K) keratinocytes and Merkel cells (J) or CaV2.1+ CD200+ Merkel cells (E-G). Line arrowheads designate TD borders (B-I) and block arrowheads designate Schwann cells (F,G). Dashed line designates the epidermal-dermal junction. E-G, H,I and L,M represent a series of the same image. AF, afferent fiber; dm, dermis; IFE, interfollicular epidermis; MC, Merkel cell; SC, Schwann cell. Scale bars: 60 μm in A-D; 20 μm in E-M. (N-P) FACS dot (N) and contour (O,P) plots showing detection of α6 integrin, CD34, Sca1 and CD200 in epithelial keratinocytes.
Fig. 2.
Fig. 2.
Skin grafts and lineage analysis of TD progenitor cells (TDPCs). (A-F) Mouse skin grafts captured 6 weeks post-grafting (A-C) and X-gal-stained (arrowheads) 2-week grafts (D-F). Circle designates graft perimeter. There was no X-gal staining in Nude skin (F). (G-V) Four-week TD grafts. Arrows point to β-gal+ K8+ Merkel cells (G-J); β-gal+ K14+ basal (K-N) and β-gal+ K1+ suprabasal (O-R) keratinocytes; and NF-H+ afferents innervating K8+ Merkel cells (S-V). Each column represents the same image; merged panels demonstrate colabeled cells for each staining combination (J,N,R) or NF-H+ afferent fibers (V). The dashed line designates the epidermal-dermal junction. Scale bar: 50 μm. (W) Quantification of TDs (#TDs) in 2-week (upper) and 4-week (lower) grafts (average section length was 8 mm) and the number (with percentage) of TDs that co-expressed β-gal and K8 in each group. DF, dermal fibroblast control; dm, dermis; IFE, interfollicular epidermis; ND, not detected.
Fig. 3.
Fig. 3.
Microarray RNA expression analysis of TDPCs. (A,B) Top 30 upregulated (A) and downregulated (B) transcripts in FACS-sorted mouse TD cells compared with IFEΔTD cells, ranked by fold change. Each list is accompanied by a heat map expression analysis. (C,D) Pie charts depicting gene expression cluster overviews for TD upregulated (C) and downregulated (D) genes.
Fig. 4.
Fig. 4.
RT-PCR and immunofluorescence analysis of TD regulated genes. (A) RT-PCR analysis of the TD enriched genes Ctgf, Foxc1 and Fzd7 with (+) or without (–) reverse transcriptase. Gapdh, K14 and water (C) were included as controls. (B-G) Ctgf (arrow) and K8 colabeling (B-D) or connexin 43 and K8 colabeling (E-G) in mouse skin. The dashed line designates the basement membrane. Asterisks designate connexin 43 labeling in the IFE (*) and TD (**). Insets (F) are at 1.5× magnification. dm, dermis; IFE, interfollicular epidermis; MC, Merkel cell. Scale bars: 20 μm in B-D; 40 μm in E-G.

References

    1. Andres C., Belloni B., Puchta U., Sander C. A., Flaig M. J. (2010). Prevalence of MCPyV in Merkel cell carcinoma and non-MCC tumors. J. Cutan. Pathol. 37, 28-34 - PubMed
    1. Bindea G., Mlecnik B., Hackl H., Charoentong P., Tosolini M., Kirilovsky A., Fridman W. H., Pagès F., Trajanoski Z., Galon J. (2009). ClueGO: a Cytoscape plug-in to decipher functionally grouped gene ontology and pathway annotation networks. Bioinformatics 25, 1091-1093 - PMC - PubMed
    1. Dassule H. R., Lewis P., Bei M., Maas R., McMahon A. P. (2000). Sonic hedgehog regulates growth and morphogenesis of the tooth. Development 127, 4775-4785 - PubMed
    1. Feng H., Shuda M., Chang Y., Moore P. S. (2008). Clonal integration of a polyomavirus in human Merkel cell carcinoma. Science 319, 1096-1100 - PMC - PubMed
    1. Haeberle H., Fujiwara M., Chuang J., Medina M. M., Panditrao M. V., Bechstedt S., Howard J., Lumpkin E. A. (2004). Molecular profiling reveals synaptic release machinery in Merkel cells. Proc. Natl. Acad. Sci. USA 101, 14503-14508 - PMC - PubMed

Publication types

MeSH terms