Review
. 2010 Dec;9(12):3137-44.
doi: 10.1158/1535-7163.MCT-10-0642. Epub 2010 Nov 1.

Proof of concept: network and systems biology approaches aid in the discovery of potent anticancer drug combinations

Affiliations
Review

Proof of concept: network and systems biology approaches aid in the discovery of potent anticancer drug combinations

Asfar S Azmi et al. Mol Cancer Ther. 2010 Dec.

Abstract

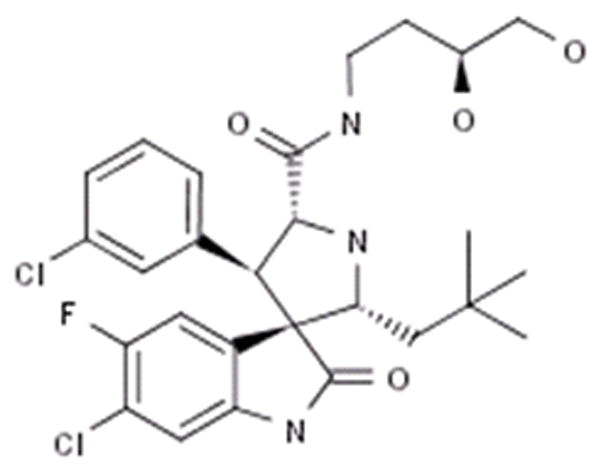
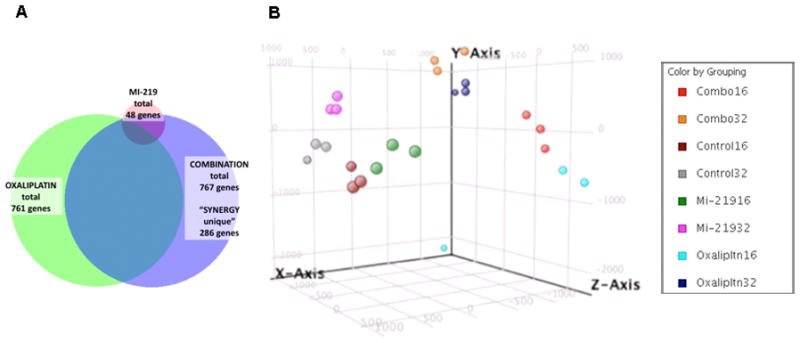
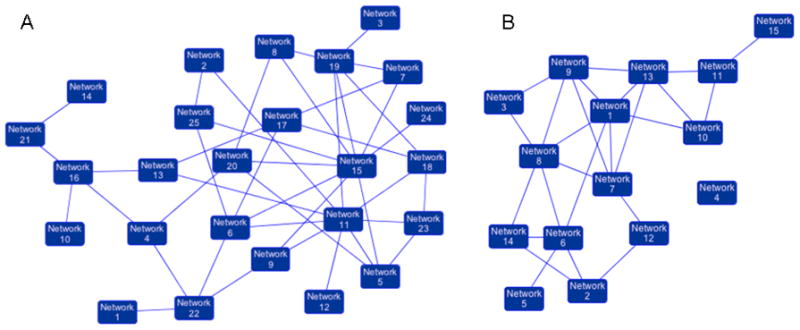
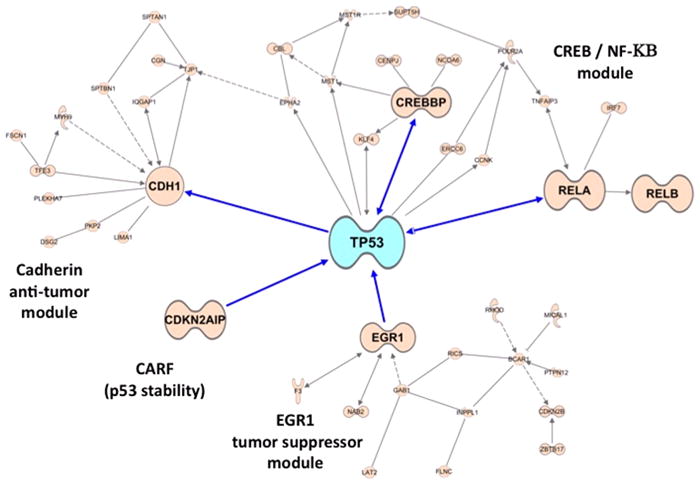
Cancer therapies that target key molecules have not fulfilled expected promises for most common malignancies. Major challenges include the incomplete understanding and validation of these targets in patients, the multiplicity and complexity of genetic and epigenetic changes in the majority of cancers, and the redundancies and cross-talk found in key signaling pathways. Collectively, the uses of single-pathway targeted approaches are not effective therapies for human malignancies. To overcome these barriers, it is important to understand the molecular cross-talk among key signaling pathways and how they may be altered by targeted agents. Innovative approaches are needed, such as understanding the global physiologic environment of target proteins and the effects of modifying them without losing key molecular details. Such strategies will aid the design of novel therapeutics and their combinations against multifaceted diseases, in which efficacious combination therapies will focus on altering multiple pathways rather than single proteins. Integrated network modeling and systems biology have emerged as powerful tools benefiting our understanding of drug mechanisms of action in real time. This review highlights the significance of the network and systems biology-based strategy and presents a proof of concept recently validated in our laboratory using the example of a combination treatment of oxaliplatin and the MDM2 inhibitor MI-219 in genetically complex and incurable pancreatic adenocarcinoma.


Conflict of interest statement

Potential Conflict of Interest: There are no potential conflicts of interest for any of the authors.

Figures

Figure 1
Figure 1
Structure of the MDM2 inhibitor MI-219.
Figure 2
Figure 2. Gene expression microarray profiling and molecular network modeling predicts synergy between two drugs at the gene level. [A]
Venn Diagram showing synergy between MDM2 inhibitor MI-219 and oxaliplatin. Note: emergence of 286 synergy unique genes in the combination group. [B] Principle component analysis showing global gene patterns post drug treatments: single treatment vs combination at different time points. Analysis is representative of biological triplicates of Capan-2 pancreatic adenocarcinoma cells (i) untreated; (ii) MI-219 treated (15 μM); (iii) oxaliplatin treated (15 μM); and (iv) MI-219 (15 μM) + oxaliplatin (15μM) combination treatment for 16 and 32 hrs. RNA quality was assessed by Agilent Bioanalyzer 2100 RIN analysis. Expression levels at each time point and treatment were determined by microarray analyses using the human HT12 array. Data were processed for quality control and normalized across compared arrays by quantile normalization. Genes with 1.7 or greater expression fold-change at any time point in the series were included in Ingenuity Pathway Analyses. Cluster analysis of expression profiles was performed with Bayesian analysis using CAGED software. Canonical pathways analysis identified the pathways from the Ingenuity Pathways Analysis library of canonical pathways that were most significant to the data set. Molecules from the data set that met the 1.7 fold-change cut-off and were associated with a canonical pathway in Ingenuity’s Knowledge Base were considered for the analysis. The significance of the association between the data set and the canonical pathway was measured in 2 ways: 1) a ratio of the number of molecules from the dataset that map to the pathway divided by the total number of molecules that map to the canonical pathway; 2) Fisher’s exact test was used to calculate a p-value determining the probability that the association between the genes in the dataset and the canonical pathway is explained by chance alone.
Figure 3
Figure 3. Synergy between MI-219 and oxaliplatin is a consequence of multiple closely knit pathway interactions
[A] Network analysis of a total of 767 genes showing 22 statistically enriched and biologically meaningful pathways. [B] Network analysis of 286 synergy unique genes showing statistical enrichment of 14 biologically meaningful pathways.
Figure 4
Figure 4. A p53 hub is activated by MI-219-oxaliplatin in Capan-2 cells
Pathway network modeling of statistically enriched local networks involved in the re-activation of p53 in Capan-2 cells post 32 hr treatment as described in Fig-1. Note: interaction with cadherin anti-tumor module, NF-κB, p53 stabilizing protein EGR1 and CREBBP, and the MDM2 negative regulator CARF (known to further drives p53 reactivation and apoptosis).
Figure 5
Figure 5. Hepatocyte nuclear factor 4 alpha (HNF4α) is a novel target in MI-219 response network
[A & B] Pathway network modeling of MI-219 treated at 16 and 32 hrs showing down-regulation of HNF4α and related network genes; [C] Pathway network modeling of combination treatment showing down-regulation of HNF4α target genes. Red (Genes that are up-regulated); Green (Genes that are down-regulated); [D] Gene expression profile of 48 healthy tissues and 68 cancer types reveals HNF4α high expression specific to pancreatic tumors.

References

    1. Wilson TR, Johnston PG, Longley DB. Anti-apoptotic mechanisms of drug resistance in cancer. Curr Cancer Drug Targets. 2009;9:307–19. - PubMed
    1. Newell DR. How to develop a successful cancer drug--molecules to medicines or targets to treatments? Eur J Cancer. 2005;41:676–82. - PubMed
    1. Heng HH, Bremer SW, Stevens JB, Ye KJ, Liu G, Ye CJ. Genetic and epigenetic heterogeneity in cancer: a genome-centric perspective. J Cell Physiol. 2009;220:538–47. - PubMed
    1. Le TC, Stathis A, Vidal L, Moore MJ, Siu LL. Choice of starting dose for molecularly targeted agents evaluated in first-in-human phase I cancer clinical trials. J Clin Oncol. 2010;28:1401–7. - PubMed
    1. Wist AD, Berger SI, Iyengar R. Systems pharmacology and genome medicine: a future perspective. Genome Med. 2009;1:11. - PMC - PubMed

Publication types