. 2010 Nov 1;24(21):2408-19.
doi: 10.1101/gad.1987810.

Delta40p53 controls the switch from pluripotency to differentiation by regulating IGF signaling in ESCs

Affiliations

Delta40p53 controls the switch from pluripotency to differentiation by regulating IGF signaling in ESCs

Erica Ungewitter et al. Genes Dev. .

Abstract

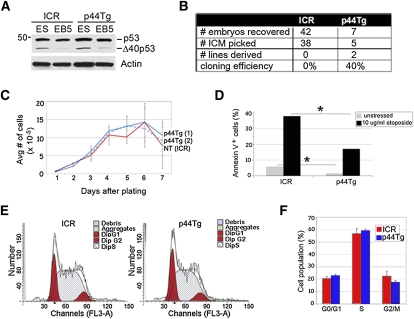
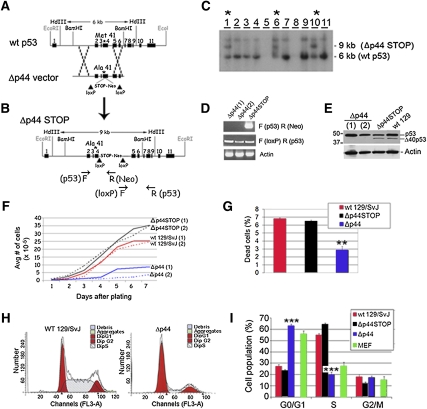
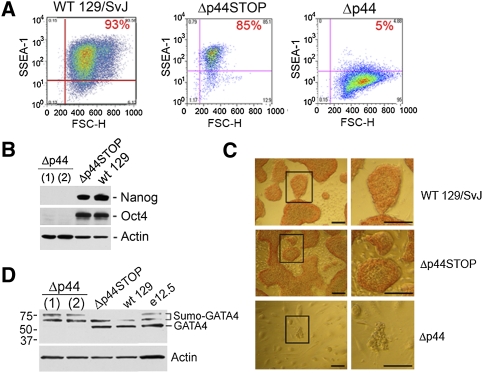
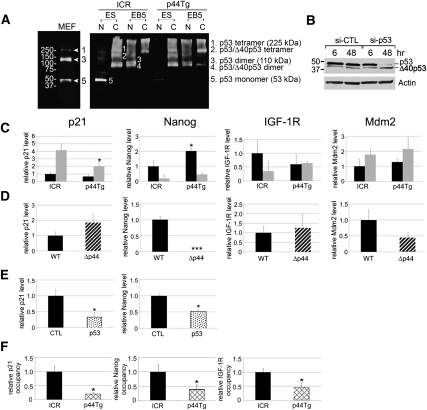
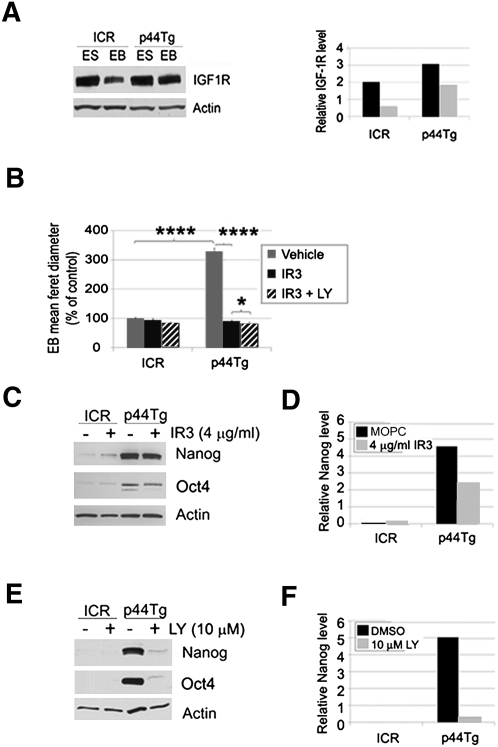
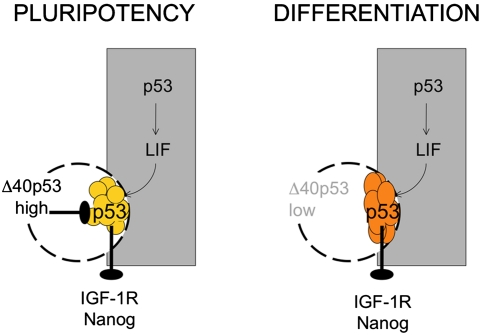
Δ40p53 is a transactivation-deficient isoform of the tumor suppressor p53. We discovered that Δ40p53, in addition to being highly expressed in embryonic stem cells (ESCs), is the major p53 isoform during early stages of embryogenesis in the mouse. By altering the dose of Δ40p53 in ESCs, we identified a critical role for this isoform in maintaining the ESC state. Haploinsufficiency for Δ40p53 causes a loss of pluripotency in ESCs and acquisition of a somatic cell cycle, while increased dosage of Δ40p53 prolongs pluripotency and inhibits progression to a more differentiated state. Δ40p53 controls the switch from pluripotent ESCs to differentiated somatic cells by controlling the activity of full-length p53 at critical targets such as Nanog and the IGF-1 receptor (IGF-1R). The IGF axis plays a central role in the switch between pluripotency and differentiation in ESCs-and Δ40p53, by controlling the level of the IGF-1R, acts as a master regulator of this switch. We propose that this is the primary function of Δ40p53 in cells of the early embryo and stem cells, which are the only normal cells in which this isoform is expressed.


Figures

Figure 1.
Figure 1.
Δ40p53 is highly expressed in undifferentiated ESCs and early post-implantation embryos. (A) Schematic representation of pertinent p53 protein isoforms. The major functional domains are described fully in the text. (Yellow) Primary transactivation domain (AD1); (red) second transactivation domain (AD2) and proline-rich domain (PRD); (blue) DNA-binding domain (DBD); (gray) tetramerization domain (TD); (green) basic domain (BD). (Arrowheads) Locations of epitopes recognized by the p53 antibodies used in these studies. CM5 is a polyclonal antibody that recognizes multiple unknown epitopes (Lane et al. 1996). (B–E) p53 isoform expression in mouse cells and tissues. All cells and tissues were derived from ICR mice, unless otherwise indicated. (B) Mouse ESCs and MEFs. (C) Adult tissues. (D) EBs differentiated for 5 d (EB5) or 9 d (EB9) prior to harvest; the table gives the quantitation of each isoform normalized to actin. (E) Embryos derived from natural matings, with extraembryonic tissues removed prior to analysis; timings are indicated in days post-coitum (dpc); the table gives the quantitation of each isoform normalized to GAPDH. (F) Subcellular localization of Δ40p53 and p53 in ESCs. Nuclear (N) and cytosolic (C) cell fractions isolated from normal 129/SvJ and ICR or p44Tg ESCs and analyzed by Western blotting. Ratios of normalized values of Δ40p53 to full-length p53 are indicated below each lane. (G) Immunolocalization of p53 in ESCs. Immunofluorescent staining for PAb248 (top, green) and PAb421 (bottom, green) was performed on wild-type 129/SvJ ESCs, and nuclei were counterstained with DRAQ5. Images are 1 μM confocal sections collected using a Zeiss Std510 microscope; red dashed lines were traced around the nuclear envelope boundary, and white dashed lines were traced around the outer cell membrane. Bar, 10 μm. See also Supplemental Figure S1.
Figure 2.
Figure 2.
Δ40p53 promotes ESC survival. (A) p53 isoform expression in normal and p44Tg ESCs and EBs. Western blot reacted with PAb248 for p53 isoform expression and actin for total protein. (B) Derivation of ESCs from wild-type (ICR) and p44Tg embryos. The inner cell mass (ICM) was isolated from each embryo that survived to the expanded blastocyst stage. Cloning efficiency is calculated as the number of ESC lines established from all inner cell masses picked. (C) Growth curves of p44Tg (blue) and nontransgenic (red) ESCs. Data points represent the average ± SD of triplicate samples counted daily. Three to five replica assays were performed per cell group. Two independent clones of p44Tg ESCs were analyzed, and are designated by the solid and dashed lines. (D) Apoptosis in stressed and unstressed ESCs. Apoptosis is expressed as the percentage of Annexin V-positive cells in FACS-sorted populations. (*) P < 0.005 (Pearson's χ2 test). (Gray bars) Untreated cells; (black bars) cells treated with 10 mg/mL etoposide. (E,F) Cell cycle profiles of ICR and p44Tg ESCs. (E) DNA content in ICR (left) and p44Tg (right) ESCs analyzed by FACS and MODFIT. (F) Cell cycle distribution in ICR (red bars) and p44Tg (blue bars) ESCs. Values represent mean ± SEM of six to 10 samples per genotype.
Figure 3.
Figure 3.
Δ40p53 is required for ESC proliferation. (A,B) Gene targeting strategy used to generate ESCs with reduced levels of Δ40p53. (A) Homologous recombination between the normal p53 allele (top) and the Δp44 targeting vector (bottom) results in replacement of Met41 with Ala41 and insertion of a floxed neomycin selection cassette with a pA-STOP sequence. (B) Resultant Δp44STOP allele. Primers used to detect the mutant allele following Cre recombinase-mediated deletion of the Neo-STOP cassette are illustrated below. (C) Identification of correctly targeted clones by Southern blot analysis. In HindIII-digested DNA, the normal allele is 6 kb and the recombinant allele is 9 kb due to the insertion of the Neo-STOP cassette. (*) Correctly targeted heterozygous p53+/Δp44STOP ESC clones. (D) Identification of p53+/Δp44 ESCs by PCR analysis. Ethidium bromide (EtBr)-stained gel of PCR products before (Δp44STOP) and after [Δp44(1) and Δp44(2)] transduction of ESCs with Cre recombinase. F(p53); R(Neo) (top) and F(loxP); R(p53) (middle) primer pairs are shown in B. (Bottom) Actin and control primers. (E) p53 isoform expression in wild-type 129/SvJ, Δp44STOP, and Δp44 ESCs. Western blot reacted with PAb421 for p53 isoform expression and actin for total protein. (F) Growth curves of wild-type (129/SvJ) (red), heterozygous p53+/Δp44 (blue), and p53+/Δp44STOP (black) ESCs. Data points represent the mean of triplicate samples counted daily. Two different clones were analyzed for each genotype, designated by the solid versus dashed lines. (G) Cell viability of p53+/Δp44 ESCs (blue) relative to wild-type (129/SvJ) (red) and p53+/Δp44STOP (black). Values represent the mean percentage of dead cells ± SEM. Dead cells were determined by LIVE/DEAD assay (Invitrogen) and total cells were determined by counting DAPI-positive nuclei. (**) P < 0.005 (Pearson's χ2 test). (H,I) Cell cycle profiles of normal and mutant ESCs. (H) DNA content in wild-type 129/SvJ (left) and p53+/Δp44 (right) ESCs analyzed by FACS and MODFIT. (I) Cell cycle distribution in 129/SvJ (red), p53+/Δp44STOP (black), and p53+/Δp44 (blue) ESCs or MEFs (green). Values represent mean ± SEM of six to 10 samples per genotype. (***) P < 0.001 (two-tailed Student's t-test).
Figure 4.
Figure 4.
Reduced Δ40p53 expression leads to spontaneous loss of ESC pluripotency. (A) Reduced SSEA-1 expression in ESCs haplosufficient for Δ40p53. FloJo FACS analysis of SSEA-1 staining (Y-axis) plotted against forward scatter (FSC) (X-axis) in wild-type (129/SvJ; left), p53+/Δp44STOP (Δp44STOP; middle), and p53+/Δp44 (Δp44; right) ESCs. (B) Loss of stem cell markers in ESCs with reduced Δ40p53. Western blot analysis of Nanog and Oct4 expression in p53+/Δp44 (Δp44) cells relative to wild-type (129/SvJ) or p53+/Δp44STOP (Δp44STOP) ESCs. Δp44(1) and Δp44(2) represent two unique p53+/Δp44 clones. (C) Decreased AP activity in ESCs with reduced Δ40p53. Histochemical detection of AP activity in p53+/Δp44 (Δp44; bottom), p53+/Δp44STOP (Δp44STOP; middle), and wild-type (129/SvJ; top) ESC colonies. Images are phase-contrast photomicrographs of cells incubated with a substrate that is converted to a red reaction product in the presence of AP. Bar, 100 μm. (D) Altered GATA-4 expression in ESCs with reduced Δ40p53. Western blot analysis of GATA-4 expression in p53+/Δp44 (Δp44), wild-type (129/SvJ), or p53+/Δp44STOP (Δp44STOP) ESCs and embryonic day 12.5 (E12.5) embryonic tissues. High-molecular-weight bands correspond to sumoylated forms of GATA-4, and are described fully in the text.
Figure 5.
Figure 5.
Increased Δ40p53 inhibits ESC differentiation. (A) Larger size of EBs with increased Δ40p53. Quantitative analysis of mean diameters of ICR and p44Tg EBs ± SEM after 4 d of EB culture. (***) P < 0.001 (two-tailed Student's t-test). (B) Improved survival of EBs with increased Δ40p53 EB viability was calculated based on the percentage of all wells plated containing at least one EB after 4 d of culture. Mean survival rates ± SEM are displayed. (***) P < 0.001 (two-tailed Student's t-test). (C–E) Impaired response to differentiation conditions in cells with increased Δ40p53. (C) Proliferation of cells during monolayer differentiation. Data are displayed as the fold change in cell number based on the number of ESCs plated on day 1. (Blue) p44Tg; (red) ICR. (D) Phenotype of cells during monolayer differentiation. Photomicrographs of ICR and p44Tg ESCs at days 0, 7, and 14 of monolayer differentiation. (Top panels) Phase contrast. (Bottom panels) Immunofluorescence with an antibody against SSEA-1. Original magnification, 40×. (E, top panel) Western blot analysis of Nanog and Oct4 expression in ICR and p44Tg ESCs and day 5 EBs. Protein quantitation in ESCs (black bars) and EBs (gray bars), normalized to actin, is displayed below. The Oct4 antibody detects a doublet at 44/42 kDa; both bands of the doublet were measured for the quantitation.
Figure 6.
Figure 6.
Δ40p53 modulates p53-mediated transcription of pluripotency genes. (A) Oligomers of p53 and Δ40p53 in normal and p44Tg ESCs and EBs. Representative Western blot of gluteraldehyde-treated nuclear (N) and cytosolic (C) fractions of ICR and p44Tg ESCs or day 5 EBs (EB5). p53 detection by PAb248. At least four samples from each genotype were tested, with consistent results. Bands corresponding to the major oligomers (based on molecular weight) are labeled according to their composition at the appropriate positions on the blot. MEF data are displayed on the far left to illustrate the distribution of p53 oligomers in cells lacking Δ40p53. (B) p53 isoform expression in normal ESCs following p53 knockdown. p53 detection by PAb248 Western blot in normal ICR ESCs 6 or 48 h after treatment with p53-siRNA (right) or nontarget control siRNA (left). (C–E) p53 transcriptional activity in ESCs and EBs with varying doses of Δ40p53. (C) p21, Nanog, IGF-1R, and Mdm2 gene expression in ICR and p44Tg ESCs (black bars) and EBs (gray bars). (D) p21, Nanog, IGF-1R, and Mdm2 gene expression in wild-type (WT 129/SvJ; black bars) and p53+/Δp44 (Δp44; striped bars) ESCs. (E) p21 and Nanog mRNA expression in ICR ESCs, 48 h after transfection with nontarget control (CTL; black bars) or p53 (stippled bars) siRNA. (F) ChIP analysis of p53 binding to the p21, Nanog, and IGF-1R promoters in ICR and p44Tg ESCs. Relative promoter occupancy by p53 in nontransgenic ICR (black bars) and p44Tg (hatched bars) ESCs was determined by quantitative PCR, with IgG binding used for a negative control. (*) P < 0.05; (***) P < 0.001 (two-tailed Student's t-test).
Figure 7.
Figure 7.
Δ40p53 regulates ESC pluripotency via IGF/PI3K signaling. (A) IGF-1R expression in normal and p44Tg ESCs and EBs. Western blot (top) and protein quantitation (bottom). (Black bars) ESCs; (gray bars) EBs. Four independent samples for each genotype and cell type were analyzed. (B) Effect of blocking IGF/PI3K signaling on EB size. Data represent the mean diameters ± SEM of ICR or p44Tg EBs after 5 d of treatment, and are expressed as percent of vehicle-treated ICR values. (Gray bars) vehicle-treated; (black bars) IR3-treated; (striped bars) IR3 LY294002-treated. Two to three sets of EB cultures were analyzed per treatment group, with each set consisting of 100–250 EBs. (*) P < 0.05; (****) P < 0.001 (two-tailed Student's t-test). (C–F) Effect of blocking IGF/PI3K signaling on expression of stem cell factors. Western blot analysis and quantitation of Nanog and Oct4 expression in EBs treated with the IGF-1R-blocking antibody IR3 (C,D) or PI3K inhibitor LY294002 (E,F). All values were normalized to actin. (Black bars) ESCs; (gray bars) EBs. See also Supplemental Figure S3.
Figure 8.
Figure 8.
A model to explain how Δ40p53 regulates the progression from pluripotency to differentiation in ESCs. In early embryos and ESCs (yellow symbols), Δ40p53 expression is high. Pluripotency is maintained by blocking p53 transsuppression of critical factors, such as Nanog and the IGF-1R. One mechanism by which this could occur could be tetramerization of p53 with Δ40p53 and sequestration in the cytoplasm. As Δ40p53 expression in the embryo declines, p53 transsuppression can occur, causing extinction of Nanog and loss of pluripotency. Reduced signaling through the IGF-1R restricts proliferation to levels typical of somatic cells. In maternal tissues, shown here as a gray box, p53 transactivates LIF, a factor essential for implantation.

Similar articles

Cited by

References

    1. Aladjem MI, Spike BT, Rodewald LW, Hope TJ, Klemm M, Jaenisch R, Wahl GM 1998. ES cells do not activate p53-dependent stress responses and undergo p53-independent apoptosis in response to DNA damage. Curr Biol 8: 145–155 - PubMed
    1. Bendall SC, Stewart MH, Menendez P, George D, Vijayaragavan K, Werbowetski-Ogilvie T, Ramos-Mejia V, Rouleau A, Yang J, Bosse M, et al. 2007. IGF and FGF cooperatively establish the regulatory stem cell niche of pluripotent human cells in vitro. Nature 448: 1015–1021 - PubMed
    1. Bourdon JC, Fernandes K, Murray-Zmijewski F, Liu G, Diot A, Xirodimas DP, Saville MK, Lane DP 2005. p53 isoforms can regulate p53 transcriptional activity. Genes Dev 19: 2122–2137 - PMC - PubMed
    1. Conti L, Pollard SM, Gorba T, Reitano E, Toselli M, Biella G, Sun Y, Sanzone S, Ying QL, Cattaneo E, et al. 2005. Niche-independent symmetrical self-renewal of a mammalian tissue stem cell. PLoS Biol 3: e283 doi: 10.1371/journal.pbio.0030283 - PMC - PubMed
    1. Corbet SW, Clarke AR, Gledhill S, Wyllie AH 1999. P53-dependent and -independent links between DNA-damage, apoptosis and mutation frequency in ES cells. Oncogene 18: 1537–1544 - PubMed

Publication types

MeSH terms