. 2011 Jan;79(1):125-35.
doi: 10.1128/IAI.00508-10. Epub 2010 Nov 1.

Coevolution of TH1, TH2, and TH17 responses during repeated pulmonary exposure to Aspergillus fumigatus conidia

Affiliations

Coevolution of TH1, TH2, and TH17 responses during repeated pulmonary exposure to Aspergillus fumigatus conidia

Benjamin J Murdock et al. Infect Immun. 2011 Jan.

Abstract

Aspergillus fumigatus, a ubiquitous airborne fungus, can cause invasive infection in immunocompromised individuals but also triggers allergic bronchopulmonary aspergillosis in a subset of otherwise healthy individuals repeatedly exposed to the organism. This study addresses a critical gap in our understanding of the immunoregulation in response to repeated exposure to A. fumigatus conidia. C57BL/6 mice were challenged intranasally with A. fumigatus conidia weekly, and leukocyte composition, activation, and cytokine production were examined after two, four, and eight challenges. Approximately 99% of A. fumigatus conidia were cleared within 24 h after inoculation, and repeated exposure to A. fumigatus conidia did not result in hyphal growth or accumulation of conidia with time. After 2 challenges, there was an early influx of neutrophils and regulatory T (T(reg)) cells into the lungs but minimal inflammation. Repeated exposure promoted sustained expansion of the draining lymph nodes, while the influx of eosinophils and other myeloid cells into the lungs peaked after four exposures and then decreased despite continued A. fumigatus challenges. Goblet cell metaplasia and low-level fibrosis were evident during the response. Repeated exposure to A. fumigatus conidia induced T cell activation in the lungs and the codevelopment by four exposures of T(H)1, T(H)2, and T(H)17 responses in the lungs, which were maintained through eight exposures. Changes in CD4 T cell polarization or T(reg) numbers did not account for the reduction in myeloid cell numbers later in the response, suggesting a non-T-cell regulatory pathway involved in dampening inflammation during repeated exposure to A. fumigatus conidia.


Figures

FIG. 1.
FIG. 1.
(A) Cellular infiltrate around the airways, goblet cell metaplasia, and collagen deposition following repeated intranasal exposure to Aspergillus fumigatus conidia. Lungs from nonchallenged mice (Untreated) and from mice challenged two, four, or eight times were fixed in formalin and embedded in paraffin blocks. Histological slices were then stained with either H&E, PAS, or Masson's trichrome stain. Magnifications, ×400 for H&E and PAS; ×200 for trichrome. (B) Multinucleated giant cells were observed in the lungs of mice challenged four times with conidia. Magnifications are given below the images.
FIG. 2.
FIG. 2.
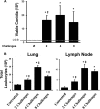
Fungal clearance and pulmonary inflammation following intranasal challenges. (A) Twenty-four hours after the final challenge, lungs were digested; an aliquot of the digest was serially diluted and plated onto SDA medium; and mycelial colonies were counted. Bars show the average numbers of viable conidia per lung detected 24 h after no challenge or two, four, or eight challenges. (B) Leukocyte influx into the lungs during the inflammatory response and expansion of lymphocytes in the mediastinal (draining) lymph node following repeated exposure to A. fumigatus conidia. Data are means ± standard errors of the means; numbers of animals and replicates are provided in Materials and Methods. *, P < 0.05 for comparison to no exposure; ‡, P < 0.05 for comparison to the previous “challenge” time point.
FIG. 3.
FIG. 3.
Neutrophil and eosinophil influx into the lungs during the inflammatory response. Data are means ± standard errors of the means; numbers of animals and replicates are provided in Materials and Methods. *, P < 0.05 for comparison to no exposure; ‡, P < 0.05 for comparison to the previous “challenge” time point.
FIG. 4.
FIG. 4.
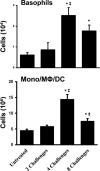
Basophil and monocyte/macrophage/DC influx into the lungs during the inflammatory response. Mφ, macrophages. Data are means ± standard errors of the means; numbers of animals and replicates are provided in Materials and Methods. *, P < 0.05 for comparison to no exposure; ‡, P < 0.05 for comparison to the previous “challenge” time point.
FIG. 5.
FIG. 5.
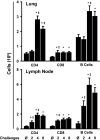
Expansion of the lymphocyte populations in both the lung and the mediastinal lymph node. Data are means ± standard errors of the means; numbers of animals and replicates are provided in Materials and Methods. *, P < 0.05 for comparison to no exposure; ‡, P < 0.05 for comparison to the previous “challenge” time point.
FIG. 6.
FIG. 6.
CD4 T cell activation in response to A. fumigatus conidia in the lung and lymph nodes. Lung and lymph node CD4 T cells were isolated via gating, and those that were CD44high CD69+ were counted as activated. Both the percentage and the total number of activated CD4 T cells in the lung and lymph nodes were calculated for each mouse and averaged for each time point. Data are means ± standard errors of the means; numbers of animals and replicates are provided in Materials and Methods. *, P < 0.05 for comparison to no exposure; ‡, P < 0.05 for comparison to the previous “challenge” time point.
FIG. 7.
FIG. 7.
Distinct CD4 cytokine profiles in the lung following each stage of the immune response to A. fumigatus. (A) Cells taken from the lung were stimulated for 6 h with PMA and ionomycin and were then stained with fluorescently labeled antibodies specific for CD45 and CD4. Following permeabilization, cells were stained for intracellular IFN-γ, IL-4, IL-10, and IL-17 expression. The mean total number of CD4 T cells expressing each cytokine is shown. (B) The mean number of CD4 T cells expressing multiple cytokines is shown. Data are means ± standard errors of the means; numbers of animals and replicates are provided in Materials and Methods. *, P < 0.05 for comparison to no exposure; ‡, P < 0.05 for comparison to the previous “challenge” time point.
FIG. 8.
FIG. 8.
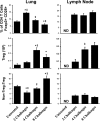
Regulatory CD4 T cells in the lung and lymph node during repeated A. fumigatus exposure. Cells taken from both the lung and the mesenchymal lymph node were stained for CD45, CD4, and CD25. Then, following permeabilization, cells were stained for intracellular Foxp3 expression. The non-Treg/Treg ratio was determined by comparing the percentage of CD4 T cells that were double positive for CD25 and Foxp3 to the percentage of those that were double negative. Each bar represents the mean for mice at a single time point, and error bars represent standard errors of the means. Numbers of animals and replicates are provided in Materials and Methods. *, P < 0.05 for comparison to no exposure; ‡, P < 0.05 for comparison to the previous “challenge” time point.
FIG. 9.
FIG. 9.
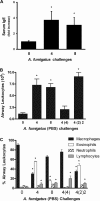
Characterization of the inflammatory response to prolonged continuous or intermittent A. fumigatus inhalational exposure. (A) Serum IgE was measured for each mouse in two independent experiments. Bars represent mean relative serum IgE levels in mice challenged four and eight times. *, P < 0.05 versus no challenge. (B) After mice were treated with variable numbers of weekly exposures to A. fumigatus (for which the PBS vehicle was sometimes substituted), airway leukocytes were recovered by BAL and were counted under a light microscope. The numbers of exposures to the PBS vehicle are given in parentheses, and the order of the numbers indicates the sequence of the exposures [e.g., “4 (2) 2” indicates 4 weekly A. fumigatus exposures followed by 2 weekly PBS exposures, which, in turn, were followed by 2 weekly A. fumigatus exposures]. Each bar represents the mean of data compiled from two independent experiments, except for “0” and “4 (4),” for each of which data were from one experiment (≥4 mice per group per experiment). (C) After mice were treated with variable numbers of weekly exposures to A. fumigatus (for which control exposures to PBS vehicle were sometimes substituted), flow cytometric leukocyte differential analyses were performed on BAL fluid cells. Data are means ± standard errors of the means; numbers of animals and replicates are provided in Materials and Methods. *, P < 0.05 for comparison to no exposure.

Similar articles

Cited by

References

    1. Aebischer, C. C., U. Frey, and M. H. Schoni. 2002. Hypersensitivity pneumonitis in a five-year-old boy: an unusual antigen source. Pediatr. Pulmonol. 33:77-78. - PubMed
    1. Armstrong-James, D. P., S. A. Turnbull, I. Teo, J. Stark, N. J. Rogers, T. R. Rogers, E. Bignell, and K. Haynes. 2009. Impaired interferon-gamma responses, increased interleukin-17 expression, and a tumor necrosis factor-alpha transcriptional program in invasive aspergillosis. J. Infect. Dis. 200:1341-1351. - PubMed
    1. Bartlett, N. W., R. P. Walton, M. R. Edwards, J. Aniscenko, G. Caramori, J. Zhu, N. Glanville, K. J. Choy, P. Jourdan, J. Burnet, T. J. Tuthill, M. S. Pedrick, M. J. Hurle, C. Plumpton, N. A. Sharp, J. N. Bussell, D. M. Swallow, J. Schwarze, B. Guy, J. W. Almond, P. K. Jeffery, C. M. Lloyd, A. Papi, R. A. Killington, D. J. Rowlands, E. D. Blair, N. J. Clarke, and S. L. Johnston. 2008. Mouse models of rhinovirus-induced disease and exacerbation of allergic airway inflammation. Nat. Med. 14:199-204. - PMC - PubMed
    1. Beasley, R., E. D. Coleman, Y. Hermon, P. E. Holst, T. V. O'Donnell, and M. Tobias. 1988. Viral respiratory tract infection and exacerbations of asthma in adult patients. Thorax 43:679-683. - PMC - PubMed
    1. Bellocchio, S., S. Moretti, K. Perruccio, F. Fallarino, S. Bozza, C. Montagnoli, P. Mosci, G. B. Lipford, L. Pitzurra, and L. Romani. 2004. TLRs govern neutrophil activity in aspergillosis. J. Immunol. 173:7406-7415. - PubMed

Publication types