. 2010 Dec 15;588(Pt 24):4969-85.
doi: 10.1113/jphysiol.2010.199034. Epub 2010 Nov 1.

Mechanosensitivity of Nav1.5, a voltage-sensitive sodium channel

Affiliations

Mechanosensitivity of Nav1.5, a voltage-sensitive sodium channel

Arthur Beyder et al. J Physiol. .

Abstract

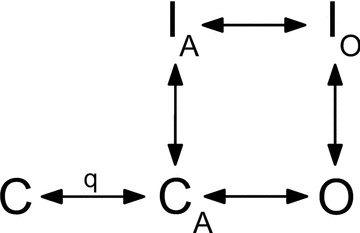
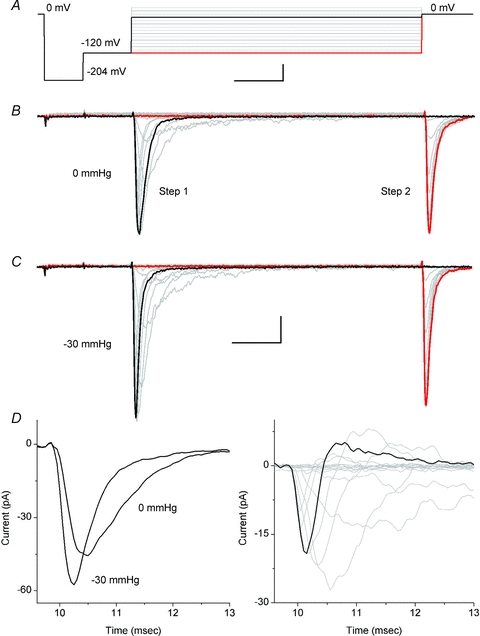
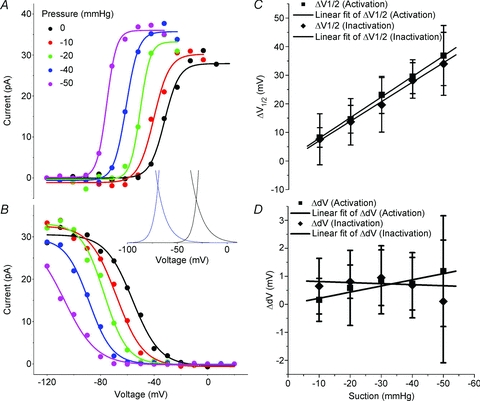
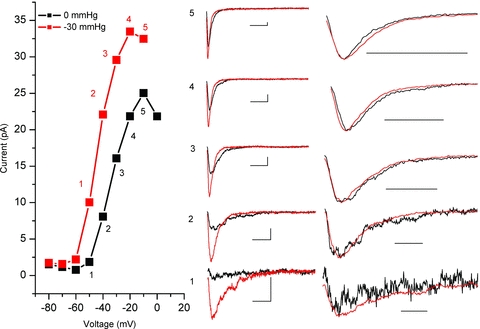
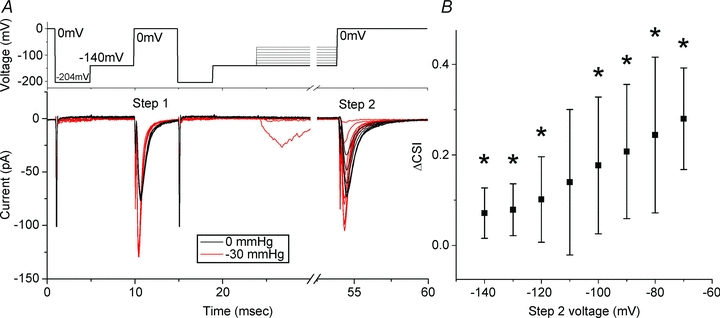
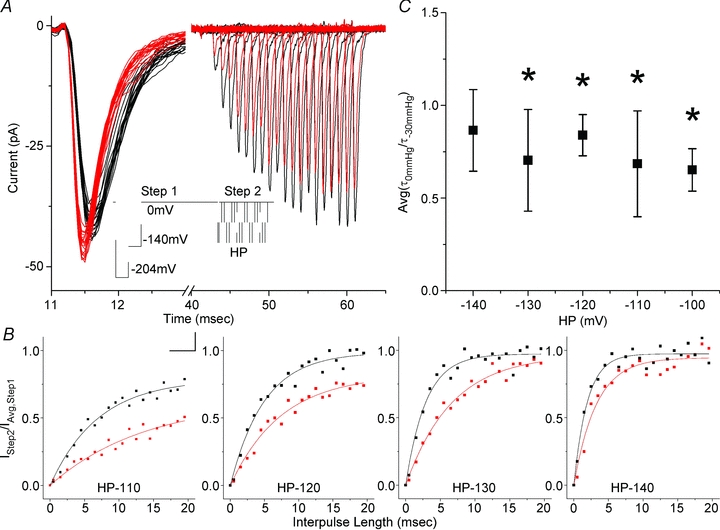
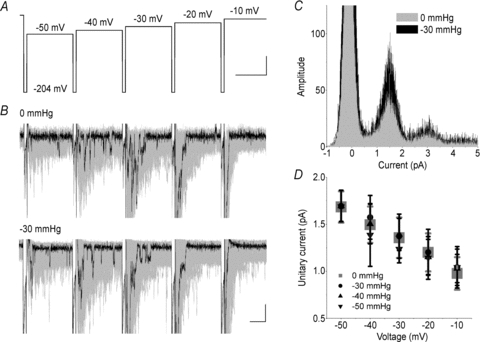
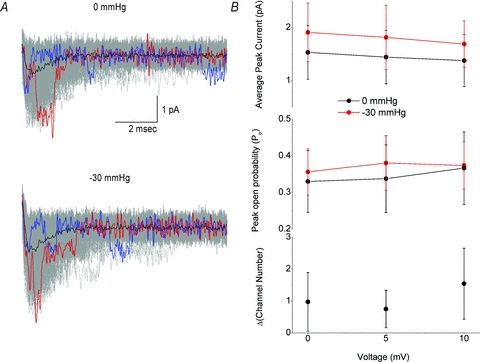
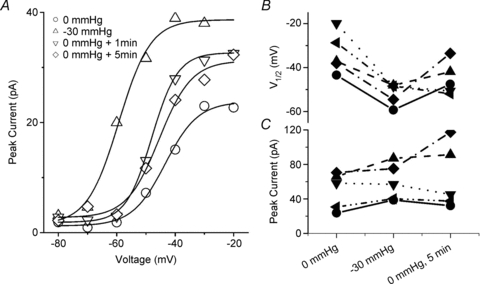
The voltage-sensitive sodium channel Na(v)1.5 (encoded by SCN5A) is expressed in electromechanical organs and is mechanosensitive. This study aimed to determine the mechanosensitive transitions of Na(v)1.5 at the molecular level. Na(v)1.5 was expressed in HEK 293 cells and mechanosensitivity was studied in cell-attached patches. Patch pressure up to -50 mmHg produced increases in current and large hyperpolarizing shifts of voltage dependence with graded shifts of half-activation and half-inactivation voltages (V(1/2)) by ∼0.7 mV mmHg(-1). Voltage dependence shifts affected channel kinetics by a single constant. This suggested that stretch accelerated only one of the activation transitions. Stretch accelerated voltage sensor movement, but not rate constants for gate opening and fast inactivation. Stretch also appeared to stabilize the inactivated states, since recovery from inactivation was slowed with stretch. Unitary conductance and maximum open probability were unaffected by stretch, but peak current was increased due to an increased number of active channels. Stretch effects were partially reversible, but recovery following a single stretch cycle required minutes. These data suggest that mechanical activation of Na(v)1.5 results in dose-dependent voltage dependence shifts of activation and inactivation due to mechanical modulation of the voltage sensors.


Figures

Figure 1
Figure 1. Simplified Nav gating model
In the resting state all channels are in state C. With depolarization, channels proceed through the voltage-dependent (q) states, as the four voltage sensors move into the activated positions. From this activated state (CA), channels may either proceed to inactivation (CA→IA) or to the open state (O). The transition to the open conducting state (CA→O) is independent of voltage, representing opening of the intracellular gate. Shortly after opening, the channel is inactivated by an intracellular inactivation gate (O→IO). Recovery from the inactivated states may proceed without channel opening, so IO→IA→CA.
Figure 2
Figure 2. Averaged patch currents increase in peak and accelerate with stretch
A, a typical voltage protocol. From holding potential (0 mV), each 30 ms-long ladder step (starting from −120 to 20 mV in 10 mV increments) was preceded by 5 ms hyperpolarizing pulses to −204 mV and −120 mV (scale 5 ms and 50 mV). Ten averages were obtained for each averaged current experiment. B and C, average patch current at rest (0 mmHg) (B) and average patch current when stretched by a −30 mmHg stimulus (C). Peak currents evoked at the beginning of each ladder step (Step 1) and immediately after stepping to 0 mV at the end of each ladder step (Step 2) were used to analyse voltage dependence of activation and inactivation, respectively. For Step 1 black traces show patch currents in response to a depolarization to −10 mV. For Step 2 black traces show no current at 0 mV after a ‘prepulse’ of −10 mV, and red traces show current at 0 mV after a ‘prepulse’ to −120 mV. For B and C scale is 5 ms and 10 pA. D, left panel highlights the early portion of Step 1 currents at 0 and −30 mmHg for a depolarization to −10 mV. These traces clearly demonstrate that peak currents increased with stretch and showed accelerated kinetics. The right panel shows the difference in Step 1 currents from left panel (black) and at all voltages (grey) (I(t)0 mmHgI(t)−30 mmHg).
Figure 3
Figure 3. Suction effects on voltage dependence of Nav1.5 activation and inactivation showing a marked leftward shift
A, Two state Boltzmann model fits of voltage dependence of activation at pressures 0 mmHg to −50 mmHg. B, Two state Boltzmann model fits of steady-state voltage dependence of inactivation at pressures 0 mmHg to −50 mmHg. Inset shows window currents resulting from overlap of the voltage dependence of activation and inactivation at 0 mmHg and at −40 mmHg showing the leftward shift in the window current with suction. C, shift in half-point (ΔV1/2) of activation (squares) and inactivation (diamonds) (ΔV1/2=V1/2,0 mmHgV1/2,testP) with response to increasing amplitude suction stimuli from −10 to −50 mmHg. Linear fits of the shift in activation and inactivation were −0.72 ± 0.18 mV mmHg−1 (R= 0.97) and −0.68 ± 0.28 mV mmHg−1 (R= 0.99), respectively. D, shift in slope (ΔdV) of activation (squares) and inactivation (diamonds) (ΔdV= dV1/2,0 mmHg− dV1/2,testP) with response to increasing amplitude suction stimuli from −10 to −50 mmHg. Linear fits of the Boltzmann slope of activation and inactivation were 0.022 ± 0.035 mV mmHg−1 (R= 0.30) and −0.0038 ± 0.041 mV mmHg−1 (R= 0.24), respectively.
Figure 4
Figure 4. Stretch acceleration of activation and inactivation scales linearly
In the left panel, voltage dependent currents (I–V) at 0 mmHg (black) and −30 mmHg (red) are shown. Highlighted points 1–5 track increasing levels of activation. In the middle panel, for the voltage steps marked by 1–5, single time-dependent traces at resting tension (black) are plotted with the corresponding traces for this patch under −30 mmHg stretch (red). In the right panel, traces were normalized to peak current and temporally scaled to times of peak showing that a single time scaling constant accounts for the kinetic changes. Temporal scaling factors (SF) for this patch were 1.57, 1.89, 1.75, 1.47 and 1.71, for points 1–5, respectively.
Figure 5
Figure 5. Closed state inactivation (CSI) increases with stretch
A, in the top panel a typical protocol is shown. Prior to both Step 1 and Step 2 patches were stepped through −204 and −140 mV for 4 and 5 ms, respectively. Step 1 was a depolarization to 0 mV for 5 ms, which was followed by a step ladder of 30 ms pulses from −140 to −80 mV and finally a Step 2 depolarization to 0 mV. The bottom panel shows resulting currents for a typical experiment. In black, a patch at resting tension (0 mmHg) has Step 1 and Step 2 peaks that are of nearly identical height. For non-activating Step 2 voltage pulses, the difference in Step 1 and Step 2 peak heights is proportional to closed state inactivation, so CSI ∝ 1 −Istep2,max/Istep1,max,0 mV. For this experiment, CSI0 mmHg was 0.07, 0.02, 0.01, 0.03, 0.18, 0.35, 0.46 for −140 to −70 mV, respectively. In red, the same patch stretched by a −30 mmHg stimulus has Step 1 peak that is disproportionately larger than Step 2 peak. For this experiment, CSI−30 mmHg values were 0.22, 0.17, 0.23, 0.37, 0.41, 0.57, for voltages −140 to −90, respectively. Steps to −80 and −70 mV activated small currents and we not include these in the analysis because of open state inactivation. Excess CSI with stretch is ΔCSI = CSI−30 mmHg− CSI0 mmHg. For this experiment, ΔCSI was 0.15, 0.16, 0.23, 0.33, 0.34, 0.39 for −140, −130, −120, −110 and −100 mV, respectively. B, average ΔCSI for 7 patches plotted against Step 2 voltage. Marked by * are voltages at which stretch resulted in more CSI than no stretch (p < 0.05 by t-test).
Figure 6
Figure 6. Inactivation recovery is slowed with stretch
A, a two step experiment with a typical protocol is shown in the inset. All protocols had 4 ms long −204 mV and −140 mV steps preceding Step 1 to 0 mV for 20 ms to attain full inactivation. Recovery periods were variable interpulse lengths (0 to 20 ms from 0.5 ms by 1 ms increments) at HP =−140 mV, −130 mV, −120 mV, −110 mV and −100 mV before Step 2 to 0 mV to assess for recovery (scale is 10 ms and 50 mV). Currents in the figure are typical recovery at −120 mV. Stretch resulted in Step 1 current increase and acceleration of kinetics (black is 0 mmHg, red is −30 mmHg). Current inactivated fully over 20 ms Step 1 pulse (first 2 ms shown). Recovery was observed as increasing Step 2 currents. B, peak currents from Step 2 were normalized to average Step 1 peak (IStep2/IAvg,Step1) and plotted against interpulse length, showing inactivation recovery at resting pressure (0 mmHg, grey) and for a stressed patch (−30 mmHg, black). Data were fitted by an exponential described by I=I0+A(1 −e−x/τ). For this experiment, τ0 mmHg were 6.0 ± 0.60, 5.1 ± 0.43, 3.1 ± 0.31, 2.3 ± 0.34 ms and τ−30 mmHg were 16.0 ± 4.0, 7.4 ± 0.76, 6.8 ± 0.54, 3.4 ± 0.6 ms at HP −110, −120, −130, −140 mV. C, recovery from inactivation with stretch relative time constants Avg(τ0 mmHg−30 mmHg) as a function of HP voltage at −140 mV (n= 4), −130 mV (n= 4), −120 mV (n= 5), −110 mV (n= 3) and −100 mV (n= 2).
Figure 7
Figure 7. Unitary conductance is not affected by stretch
A, single channel ladder protocol was designed with a 2 ms step to −204 mV, followed by 10 mV steps from −50 mV to −10 mV. To maximize the number of single channel events, 200 ladders were acquired. B, typical currents for a patch at rest (0 mmHg) and stretched by a −30 mmHg stimulus. Black highlights a single trace. Grey shadows are overlap of all 200 traces (peaks clipped for display purposes). Segments were then cut to exclude peak activation (t= 0 to 6 ms) and single channel events were idealized for subsequent 26 ms. C, all points amplitude histogram showing single channel currents at 0 (grey) and −30 mmHg (black) for a typical data set at −30 mV. Amplitude histogram demonstrates qualitative overlap of peaks around 1.5, 3.0 and 4.5 pA for one, two and three channels open, respectively. Amplitude histograms were then fitted with single Gaussians. D, average Gauss peaks are plotted against voltage for pressures 0 to −50 mmHg (n= 5). Single channel conductances (g) were the same at all pressures, 17.3 ± 0.6, 17.7 ± 0.5, 17.3 ± 0.5, 17.2 ± 0.9, 17.0 ± 0.9, 17.3 ± 0.1 for 0 mmHg, −10 mmHg, −20 mmHg, −30 mmHg, −40 mmHg, −50 mmHg, respectively.
Figure 8
Figure 8. Open probability and channel number in a stretched patch
A, a cell-attached membrane patch was depolarized to 0, +5 and +10 mV. Top panel, at rest (0 mmHg), patch was depolarized to +5 mV, showing single traces (600, grey overlap), the trace with peak amplitude (red), and a trace with resolvable single channel openings (blue) and averaged current (black). Bottom panel, the same patch at −30 mmHg. B, top panel, average peak current at 0 mmHg (black) and −30 mmHg (red). Middle panel, max open probability (Po) at 0 mmHg (black) and −30 mmHg (red). Bottom panel, increase in active channels with stretch (ΔChannel no. = no. channels post – no. channels pre, n= 5). No change in Po was noted but a 23% increase in number of channels was seen.
Figure 9
Figure 9. Stretch-induced shift in voltage dependence of activation and the increase in peak current reverse slowly
A, Typical cell attached patch was stretched once by a −30 mmHg pulse for 30 s. I–V curves were fitted by a twostate Boltzmann model with the following parameters: at 0 mmHg (V1/2=−43 mV, dV= 5.6 mV, Ipeak= 23 pA), −30 mmHg stretch (V1/2=−59 mV, dV = 5.4 mV, Ipeak= 39 pA), 0 mmHg + 1 min (V1/2=−48 mV, dV = 5.5 mV, Ipeak= 33 pA) and 0 mmHg + 5 min (V1/2=−45 mV, dV = 5.5 mV, Ipeak= 32 pA). B, In 5 patches, voltage at half-point of activation increased uniformly with stretch, with a variable but incomplete return toward baseline. C, Peak current also increased with stretch and in all but one patch remained elevated.

Comment in

References

    1. Ackerman MJ. The long QT syndrome: ion channel diseases of the heart. Mayo Clin Proc. 1998;73:250–269. - PubMed
    1. Ackerman MJ, Splawski I, Makielski JC, Tester DJ, Will ML, Timothy KW, Keating MT, Jones G, Chadha M, Burrow CR, Stephens JC, Xu C, Judson R, Curran ME. Spectrum and prevalence of cardiac sodium channel variants among black, white, Asian, and Hispanic individuals: implications for arrhythmogenic susceptibility and Brugada/long QT syndrome genetic testing. Heart Rhythm. 2004;1:600–607. - PubMed
    1. Aldrich RW, Corey DP, Stevens CF. A reinterpretation of mammalian sodium channel gating based on single channel recording. Nature. 1983;306:436–441. - PubMed
    1. Armstrong CM. Na channel inactivation from open and closed states. Proc Natl Acad Sci U S A. 2006;103:17991–17996. - PMC - PubMed
    1. Armstrong CM, Bezanilla F. Inactivation of the sodium channel. II. Gating current experiments. J Gen Physiol. 1977;70:567–590. - PMC - PubMed

Publication types

Substances