. 2011 Jan;187(1):185-202.
doi: 10.1534/genetics.110.121400. Epub 2010 Nov 1.

Mutational effects and population dynamics during viral adaptation challenge current models

Affiliations

Mutational effects and population dynamics during viral adaptation challenge current models

Craig R Miller et al. Genetics. 2011 Jan.

Abstract

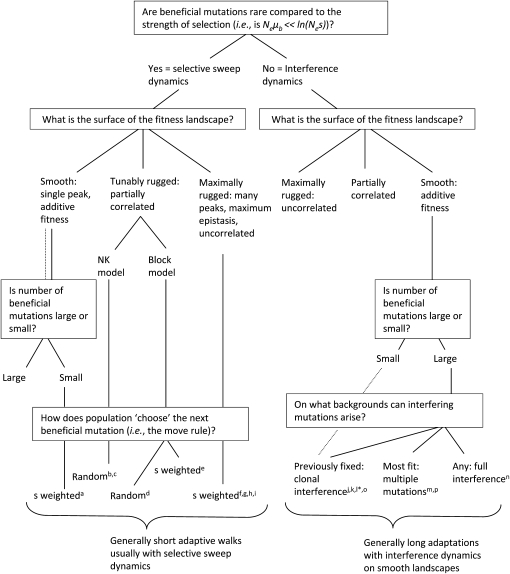
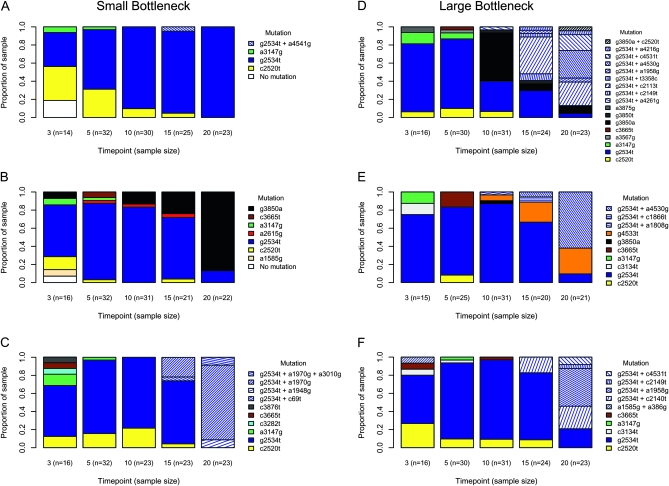
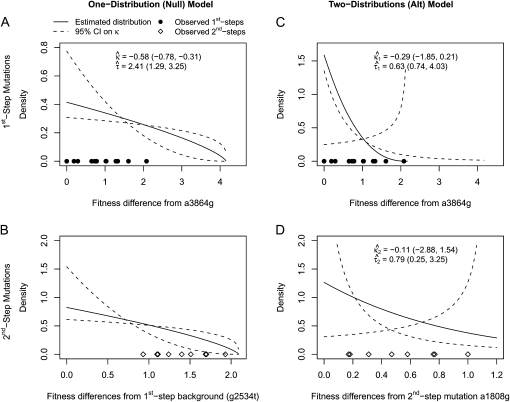
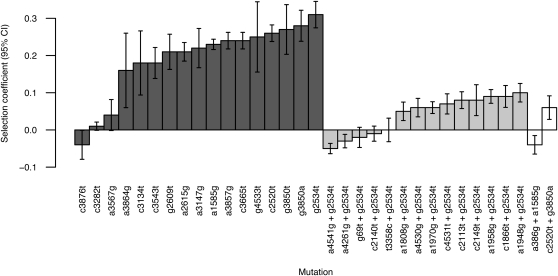
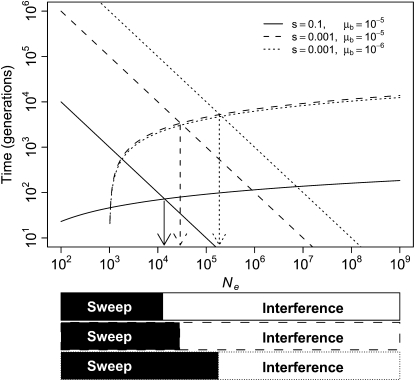
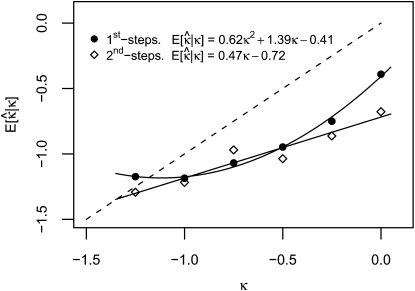
Adaptation in haploid organisms has been extensively modeled but little tested. Using a microvirid bacteriophage (ID11), we conducted serial passage adaptations at two bottleneck sizes (10(4) and 10(6)), followed by fitness assays and whole-genome sequencing of 631 individual isolates. Extensive genetic variation was observed including 22 beneficial, several nearly neutral, and several deleterious mutations. In the three large bottleneck lines, up to eight different haplotypes were observed in samples of 23 genomes from the final time point. The small bottleneck lines were less diverse. The small bottleneck lines appeared to operate near the transition between isolated selective sweeps and conditions of complex dynamics (e.g., clonal interference). The large bottleneck lines exhibited extensive interference and less stochasticity, with multiple beneficial mutations establishing on a variety of backgrounds. Several leapfrog events occurred. The distribution of first-step adaptive mutations differed significantly from the distribution of second-steps, and a surprisingly large number of second-step beneficial mutations were observed on a highly fit first-step background. Furthermore, few first-step mutations appeared as second-steps and second-steps had substantially smaller selection coefficients. Collectively, the results indicate that the fitness landscape falls between the extremes of smooth and fully uncorrelated, violating the assumptions of many current mutational landscape models.


Figures

F<sc>igure</sc> 1.—
Figure 1.—
Relationships among many mutational landscape models based on their assumptions. Superscripts indicate where models are published: a, Orr 2000; b, Kauffman 1993; c, Macken and Perelson 1989; d, Perelson and Macken 1995; e, Orr 2006; f, Gillespie 1991; g, Orr 2002; h, Rokyta et al. 2006a; i, Joyce et al. 2008; j, Gerrish and Lenski 1998; k, Wilke 2004; l, Kim and Orr 2005; m, Desai and Fisher 2007; n, Park and Krug 2007; °, Campos and de Oliveira 2004; p, Brunet et al. 2008. *The dotted line tracks the model of (l) Kim and Orr (2005), which assumes a small number of beneficial mutations on a smooth landscape and, therefore, a bounded walk. It thus does not match the “long adaptation” description at the bottom. The models of Jain and Krug (2007), Wahl and Krakauer (2000), and Hegreness et al. (2006) are not shown because they can occupy more than one region of the conceptual map.
F<sc>igure</sc> 2.—
Figure 2.—
Observed mutation frequencies across time points in replicate adaptations. To the left (A–C) are three small bottleneck (formula image) replicates; to the right (D–F) are three large bottleneck (formula image) replicates. Sample sizes (number of sequenced isolates) are shown on the horizontal axis. Note that first-step mutations are shown as solid colors, and second- and third-steps are hatched with hatch coloring corresponding to their background.
F<sc>igure</sc> 3.—
Figure 3.—
Observed fitness effects and fitted GPD distributions under the one-distribution (null) and two-distributions (alternative) models. Point estimates and 95% confidence intervals are given in insets and presented visually as solid and dashed lines, respectively. Note that confidence bounds are calculated on κ only (see materials and methods). The bounds on τ are defined on the basis of upper and lower bounds on κ to maintain a scale consistent with the point estimates. (A) First-step mutations and fitted null model. (B) Second-step mutations and fitted null model. Parameter estimates are the same as in A. (C) First-step mutations and fitted alternative model. (D) Second-step mutations and fitted alternative model. Note changes in scale on both axes between sections.
F<sc>igure</sc> 4.—
Figure 4.—
Selection coefficients and their 95% confidence intervals for all mutations in this study. Boxes with dark shading show first-step mutations on the wild-type background. Boxes with light shading show second-step mutations on the g2534t background. Open boxes show second-step mutations on another first-step background. The first-step deleterious mutation a3875g is omitted for purposes of scale. Fitness was not measured on the third-step mutation a3010g.
F<sc>igure</sc> 5.—
Figure 5.—
Transition from sweep to interference dynamics across Ne. Descending, straight lines are expected times for a beneficial mutation to establish and ascending, curved lines are expected times to fixation for an established mutation {based on testablish = 1/Neμbs and tfix ≈ [ln(Nes)]/s}. Arrows indicate Ne where approximate transitions in dynamics occur as emphasized by solid and open bands below the horizontal axis.
Figure a1
Figure a1
Figure A1.—Likelihood surface for first-step mutations under the alternative model. Note the severity of the high-likelihood ridge cutting diagonally across the surface (i.e., for a fixed λ). Also note the cliff-like drop as λ decreases (i.e., with decreasing τ and κ). The point of drop-off is defined by the largest observed fitness value.
Figure a2
Figure a2
Figure A2.—Bias correction in κ estimation. Data are simulated under known κ (horizontal axis) and used to estimate formula image. Averaged over many data sets, this approximates formula image (vertical axis). Fitting these data points to simple functions and solving for κ provides a bias correction. As a comparison, the dashed line represents an unbiased estimator.

References

    1. Akaike, H., 1974. New look at statistical-model identification. IEEE Trans. Automat. Contr. Ac19 716–723.
    1. Beisel, C. J., D. R. Rokyta, H. A. Wichman and P. Joyce, 2007. Testing the extreme value domain of attraction for distributions of beneficial fitness effects. Genetics 176 2441–2449. - PMC - PubMed
    1. Betancourt, A. J., 2009. Genomewide patterns of substitution in adaptively evolving populations of the RNA bacteriophage MS2. Genetics 181 1535–1544. - PMC - PubMed
    1. Betancourt, A. J., and J. P. Bollback, 2006. Fitness effects of beneficial mutations: the mutational landscape model in experimental evolution. Curr. Opin. Genet. Dev. 16 618–623. - PubMed
    1. Brunet, E., I. M. Rouzine and C. O. Wilke, 2008. The stochastic edge in adaptive evolution. Genetics 179 603–620. - PMC - PubMed

Publication types