. 2010 Dec;120(12):4353-65.
doi: 10.1172/JCI43910.

Activation of multiple signaling pathways causes developmental defects in mice with a Noonan syndrome–associated Sos1 mutation

Affiliations

Activation of multiple signaling pathways causes developmental defects in mice with a Noonan syndrome–associated Sos1 mutation

Peng-Chieh Chen et al. J Clin Invest. 2010 Dec.

Abstract

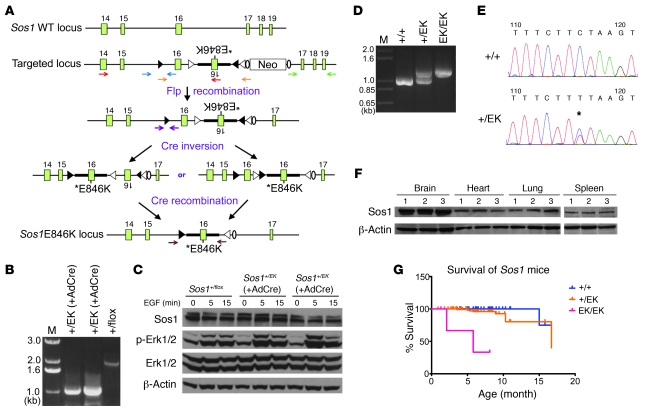
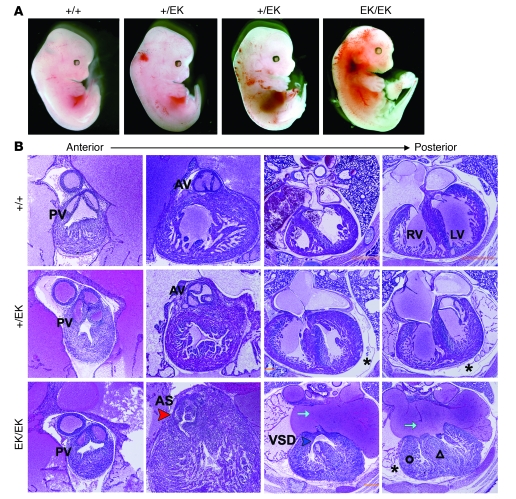
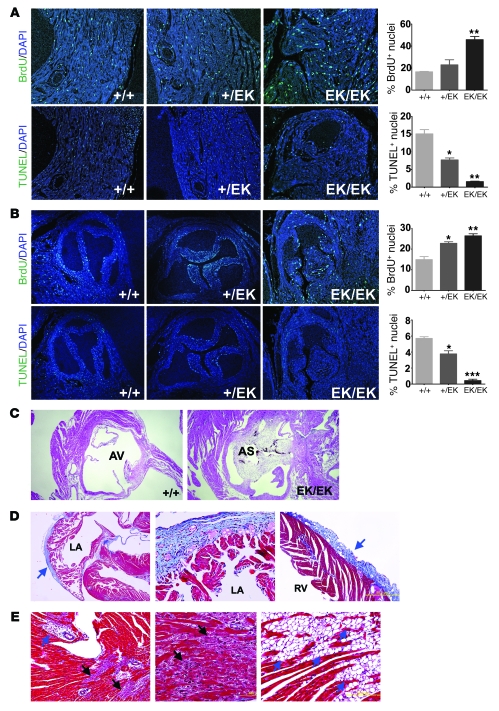
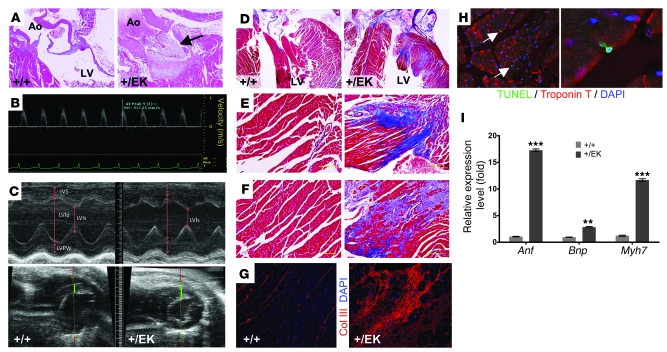
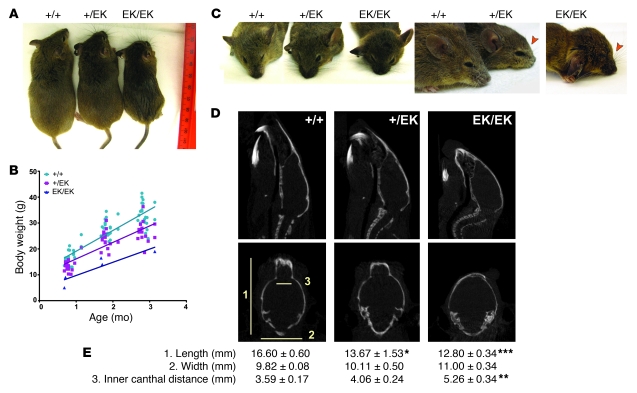
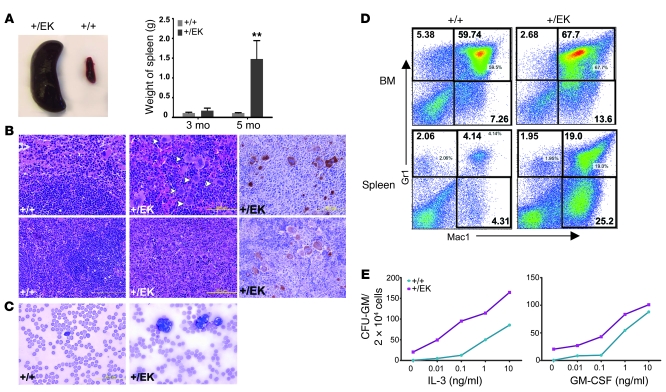
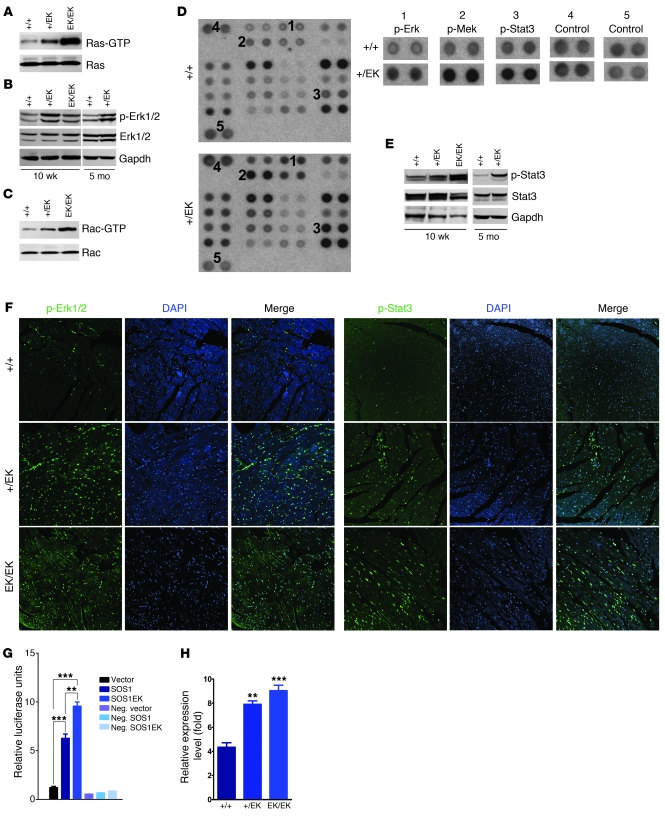
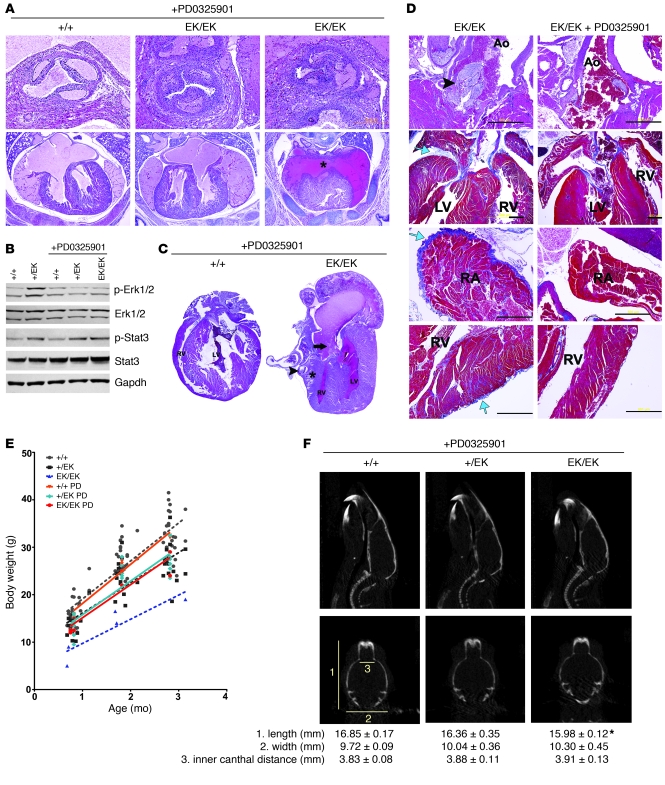
Noonan syndrome (NS) is an autosomal dominant genetic disorder characterized by short stature, unique facial features, and congenital heart disease. About 10%-15% of individuals with NS have mutations in son of sevenless 1 (SOS1), which encodes a RAS and RAC guanine nucleotide exchange factor (GEF). To understand the role of SOS1 in the pathogenesis of NS, we generated mice with the NS-associated Sos1E846K gain-of-function mutation. Both heterozygous and homozygous mutant mice showed many NS-associated pheno-types, including growth delay, distinctive facial dysmorphia, hematologic abnormalities, and cardiac defects. We found that the Ras/MAPK pathway as well as Rac and Stat3 were activated in the mutant hearts. These data provide in vivo molecular and cellular evidence that Sos1 is a GEF for Rac under physiological conditions and suggest that Rac and Stat3 activation might contribute to NS phenotypes. Furthermore, prenatal administration of a MEK inhibitor ameliorated the embryonic lethality, cardiac defects, and NS features of the homozygous mutant mice, demonstrating that this signaling pathway might represent a promising therapeutic target for NS.


Figures

Figure 1
Figure 1. Generation of knock-in mice expressing Sos1EK.
(A) Schematic representation of unidirectional targeting of Sos1EK in exon 16. When Cre recombinase is present, inversions occur either between the wloxP sites or the mloxP sites at opposite orientations, generating loxP sites with identical orientation. Subsequently, Cre recombinase mediates the excision between wloxP or mloxP sites in the same orientation, resulting in a targeted exon bearing the E846K mutation (solid triangles, wloxP; open triangles, mloxP; ovals, FRT site). Exons are indicated by rectangles. Primer pairs indicated by red, blue, green, and purple arrows were used in long-range PCR to screen positive ES cell clones (see Methods and Supplemental Figure 6). (B) Results of PCR of 2 ES cell clones with (and 1 clone without) Ad-Cre infection, showing that the desired modification has been achieved, using primer pairs indicated by orange arrows in A. M, DNA marker. Numbers indicate the size of PCR bands in kilo-base pairs (kb). (C) Sos1EK activates Erk1/2 in 2 ES cell clones after Ad-Cre infection. ES cells were starved and stimulated with EGF (25 ng/ml) and analyzed by immunoblotting. (D) PCR results for genotyping the Sos1EK-targeted locus, using primer pairs indicated by brown arrows in A. (E) Sequencing results of the RT-PCR of WT and Sos1+/EK RNAs. The asterisk indicates the E846K mutation. (F) Immunoblotting showing equal amount of Sos1 proteins in tissues of all genotypes (1, WT; 2, Sos1+/EK; 3, Sos1EK/EK). (G) Kaplan-Meier survival curves of the mice. WT, n = 92; Sos1+/EK, n = 137; P = 0.02 versus WT. Sos1EK/EK, n = 4; P < 0.001 versus WT.
Figure 2
Figure 2. Cardiac defects in Sos1EK/EK embryos.
(A) Gross appearance of E13.5 embryos. (B) Representative H&E-stained transverse sections of hearts from E15.5 embryos. Note edema (asterisks), AS (red arrowhead), ASD (cyan arrows), ventricular septal defect (VSD, blue arrowhead), right ventricular hypertrophy (open circle), and IVS hypertrophy (open triangle) in Sos1EK/EK hearts. PV, pulmonary valve. PV and AV original magnification, ×10. Four-Chamber sections original magnification, ×4.
Figure 3
Figure 3. Cardiac defects in Sos1EK/EK mice.
(A and B) Immunofluorescence staining for BrdU (top rows) and TUNEL (bottom rows) in the (A) interventricular septum and (B) aortic valve leaflets of E15.5 embryos. Graphs show quantification with error bars indicating SD. *P < 0.05, **P < 0.01, ***P < 0.001 when compared with WT littermates. (C) H&E-stained sections showing AS in 3-month-old Sos1EK/EK mice. (AC) Original magnification, ×4. (D) Masson trichrome staining of heart tissue, showing fibrosis in 3-month-old Sos1EK/EK mice. Note blue collagen staining in the left atrial (LA) epicardium (blue arrow) (left panel original magnification, ×4), with a magnified view in the middle panel (original magnification, ×20), as well as in right ventricular epicardium (right panel, original magnification, ×10). (E) Masson trichrome staining of Sos1EK/EK hearts. Black arrows indicate degenerating cardiomyocytes. Blue arrows indicate adipocytes in the area surrounding (or around) the blood vessels (left panel, original magnification, ×10) and within the interventricular septum (right panel, original magnification, ×20).
Figure 4
Figure 4. Cardiac defects in Sos1+/EK mice.
(A) Representative H&E-stained transverse sections, showing AS (arrow) in Sos1+/EK hearts. Ao, aorta. Original magnification, ×10. (B) Representative Doppler image, with measurement of ascending aortic peak velocity of an 8-month-old Sos1+/EK mouse. (C) Representative M-mode (left parasternal short axis view; top) and 2D (left parasternal long and short axes; bottom) echocardiographic images obtained from 8-month-old mice. Green bars (bottom) indicate the thickness of interventricular septum. IVS, IVS thickness; LVId, left ventricular dimension at diastole; LVIs, left ventricular dimension at systole; LVPW, left ventricular posterior wall thickness. (DF) Representative Masson trichrome staining showing fibrosis in the hearts of a 9-month-old Sos1+/EK mouse (right) but not in a WT littermate (left). (D) Original magnification, ×4. (E and F) Original magnification, ×10. (G) Immunofluorescence staining of collagen III (Col III) in the left ventricular wall. Original magnification, ×40. (H) TUNEL assay costained with the cardiomyocyte marker Troponin T, showing cardiomyocyte death in a Sos1+/EK heart; the right panel shows a higher magnification view. Arrows indicate TUNEL positive cells. Original magnification, ×40 and ×64. (I) Representative quantitative real-time PCR results, showing increased expression of cardiac hypertrophic markers in the Sos1+/EK hearts. Error bars indicate SD. **P < 0.01; ***P < 0.001.
Figure 5
Figure 5. Short stature and facial dysmorphia in Sos1EK mice.
(A) Representative appearance of 3-month-old littermates, showing reduced body length and size in Sos1 mutant mice. (B) Body weights of WT and mutant male mice with lines fit by linear regression. (P < 0.001 for Sos1+/EK versus WT and P < 0.05 for Sos1EK/EK versus WT.) (C) Facial defects in 3-month-old Sos1 mice. Arrowheads indicate blunt noses of mutant mice. (D) CT scans of 3-month-old mice. A sagittal projection (top row) and a coronal projection (bottom row) are shown. Numbers refer to the measurements shown in E. (E) Morphometric characteristics of the mice. Measurements were obtained on the CT sections at the same axial, coronal, and sagittal reference position in all mice (n = 3 for each genotype). Numbers are shown with SD. *P < 0.05, **P < 0.01, ***P < 0.001.
Figure 6
Figure 6. Sos1+/EK mice develop hematological disorder.
(A) Representative view showing splenomegaly in Sos1+/EK mice, with quantification graphed (n = 8). Error bars indicates SD. **P < 0.01. (B) Representative H&E-stained sections of spleens, showing increased numbers of megakaryocytes (white arrowheads) and massive increase of red pulp (bottom panel) in the Sos1+/EK mice. Immunohistochemistry staining showing CD41-positive megakaryocytes (brown cells; right panels). Original magnification, ×75. (C) Blood smears showing an increased number of neutrophils in Sos1+/EK mice. Original magnification, ×100. (D) Flow cytometric analysis of bone marrow and spleen, showing increased percentages of myeloid lineage (Mac1+ and Mac1+Gr1+) cells in Sos1+/EK mice (P < 0.05 for bone marrow; P < 0.01 for spleen). Numbers indicate the percentage of positively-stained cells. (E) Increased myeloid colony formation of Sos1+/EK bone marrow in the absence or presence of the indicated concentrations of GM-CSF or IL-3 (P < 0.05 and P < 0.01, respectively).
Figure 7
Figure 7. Altered signaling in Sos1EK hearts.
(A) Ras-GTP levels are increased in mutant hearts. (B) p-Erk1/2 levels are increased in mutant hearts. (C) Rac-GTP levels are increased in mutant hearts. (D) The phospho-kinase array detects phosphorylated proteins in WT and Sos1+/EK heart lysates (left panel). The right panel shows higher magnification of numbered spots on the left panel. Note increased levels of p-Erk1/2, p-Mek, and p-Stat3 in Sos1+/EK hearts. (E) Increased levels of p-Stat3 in the mutant hearts. (F) Immunofluorescence staining of p-Erk1/2 and p-Stat3 in heart sections from 3-month-old mice. Note colocalization of p-Erk1/2 and p-Stat3 with the DAPI stain. Original magnification, ×40. (G) STAT3 reporter assay showing increased STAT3 transcriptional activities in cells cotransfected with SOS1 or SOS1E846K. **P < 0.01, ***P < 0.01. neg, cotransfected with negative control vector. (H) Quantitative real-time PCR results showing increased expression of IL-6 in the Sos1EK hearts. Error bars indicate SD. n = 3 for each genotype. **P < 0.01, ***P < 0.001 when compared with WT littermates.
Figure 8
Figure 8. Prenatal treatment with the MEK inhibitor blocks development of NS features.
(A) H&E-stained sections of hearts from PD0325901-treated mice at P2. The asterisk indicates ASD. Top panel, original magnification, ×20. Bottom panel, original magnification, ×4. (B) Immunoblot showing effects of PD0325901 treatment on Erk1/2 and Stat3 activation. (C) H&E-stained section of a PD0325901-treated Sos1EK/EK mouse that died at P14. Note ASD (arrow), hypertrophic right ventricle wall (asterisk), and dilated epicardial vessels (arrowhead). (D) Representative sections of heart tissue of 3-month-old Sos1EK/EK mice with or without PD0325901 treatment. H&E-stained sections showing AS in the untreated mice (black arrowhead; row 1, original magnification, ×10). Masson Trichrome–stained sections showing fibrosis in untreated mice (rows 2–4). Note blue collagen staining (blue arrow) in left ventricular epicardium (row 2, original magnification, ×4), right atrial (RA) epicardium (row 3, original magnification, ×10), and right ventricular epicardium and myocardium (row 4, original magnification, ×10). Scale bar: 500 μm. (E) Body weight of treated and untreated male mice fit by linear regression. P < 0.01 for both PD0325901-treated Sos1+/EK mice versus PD0325901-treated WT mice and PD0325901-treated Sos1EK/EK mice versus PD0325901-treated WT mice. PD, PD0325901. (F) CT scans of treated and control mice (top row). A sagittal projection (top row) and a coronal projection (bottom row) are shown. Skull measurements are shown as in Figure 5E. *P < 0.05 when compared with WT.

References

    1. Tidyman WE, Rauen KA. The RASopathies: developmental syndromes of Ras/MAPK pathway dysregulation. Curr Opin Genet Dev. 2009;19(3):230–236. - PMC - PubMed
    1. Allanson JE. Noonan syndrome. Am J Med Genet C Semin Med Genet. 2007;145C(3):274–279. doi: 10.1002/ajmg.c.30138. - DOI - PubMed
    1. Hasle H. Malignant diseases in Noonan syndrome and related disorders. Horm Res. 2009;72(suppl 2):8–14. doi: 10.1159/000243773. - DOI - PubMed
    1. Choong K, Freedman MH, Chitayat D, Kelly EN, Taylor G, Zipursky A. Juvenile myelomonocytic leukemia and Noonan syndrome. J Pediatr Hematol Oncol. 1999;21(6):523–527. doi: 10.1097/00043426-199911000-00015. - DOI - PubMed
    1. Tartaglia M, et al. Mutations in PTPN11, encoding the protein tyrosine phosphatase SHP-2, cause Noonan syndrome. Nat Genet. 2001;29(4):465–468. doi: 10.1038/ng772. - DOI - PubMed

Publication types

MeSH terms