Comparative Study
. 2011 Aug;35(8):1031-40.
doi: 10.1038/ijo.2010.227. Epub 2010 Nov 2.

Neprilysin, obesity and the metabolic syndrome

Affiliations
Comparative Study

Neprilysin, obesity and the metabolic syndrome

K F Standeven et al. Int J Obes (Lond). 2011 Aug.

Abstract

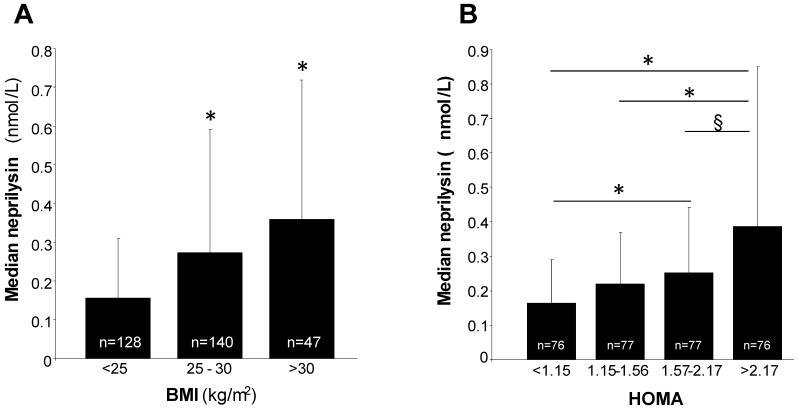
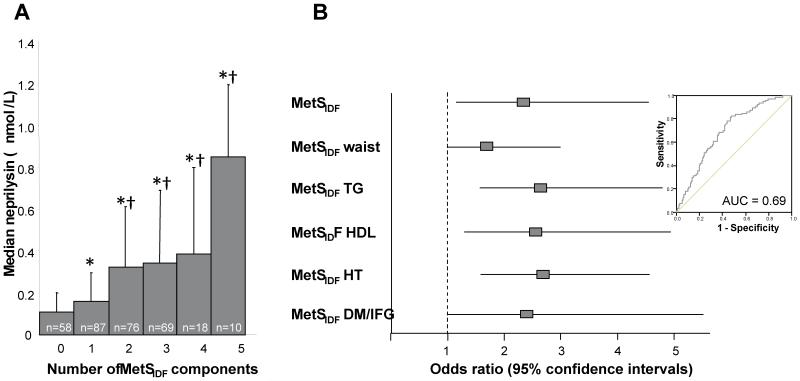
Objective: Neprilysin (NEP), a zinc metalloendopeptidase, has a role in blood pressure control and lipid metabolism. The present study tested the hypothesis that NEP is associated with insulin resistance and features of the metabolic syndrome (MetS) in a study of 318 healthy human subjects and in murine obesity, and investigated NEP production by adipocytes in-vitro.

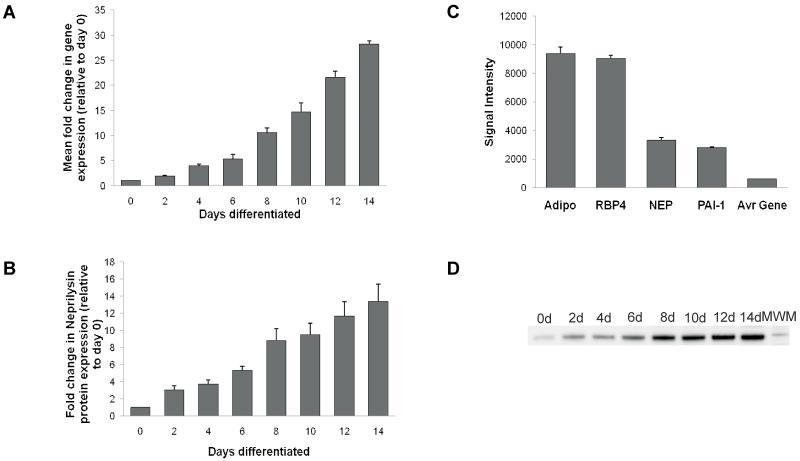
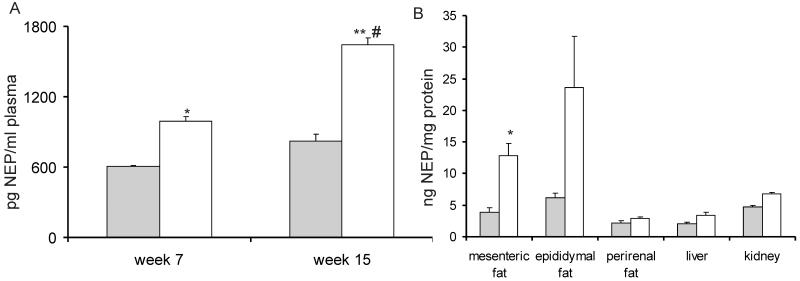
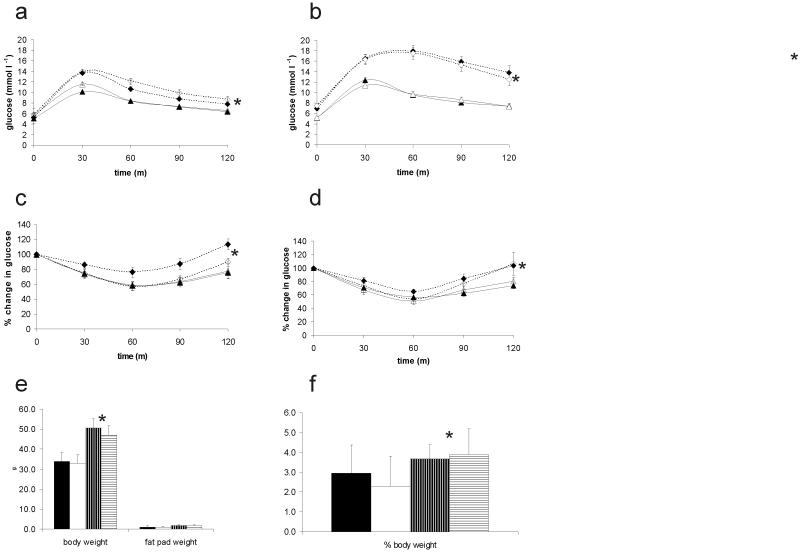
Methods and results: In 318 white European males, plasma NEP was elevated in the MetS and increased progressively with increasing MetS components. Plasma NEP activity correlated with insulin, homoeostasis model assessment and body mass index (BMI) in all subjects (P<0.01). Quantitative reverse transcriptase PCR (RT-PCR) and western blotting showed that in human pre-adipocytes NEP expression is upregulated 25- to 30-fold during differentiation into adipocytes. Microarray analysis of mRNA from differentiated human adipocytes confirmed high-NEP expression comparable with adiponectin and plasminogen activator inhibitor-1. In a murine model of diet-induced insulin resistance, plasma NEP levels were significantly higher in high-fat diet (HFD)-fed compared with normal chow diet (NCD)-fed animals (1642 ± 529 and 820 ± 487 pg μl(-1), respectively; P<0.01). Tissue NEP was increased in mesenteric fat in HFD compared with NCD-fed mice (P<0.05). NEP knockout mice did not display any changes in insulin resistance, glucose tolerance, or body and epididymal fat pad weight compared with wild-type mice.

Conclusion: In humans, NEP activity correlated with BMI and measures of insulin resistance with increasing levels in subjects with multiple cardiovascular risk factors. NEP protein production in human adipocytes increased during cell differentiation and plasma and adipose tissue levels of NEP were increased in obese insulin-resistant mice. Our results indicate that NEP associates with cardiometabolic risk in the presence of insulin resistance and increases with obesity.


Figures

Figure 1
Figure 1. Relationship between plasma NEP, insulin resistance and BMI in healthy humans
A: Plasma NEP is increased in overweight and obese subjects. Data presented as median and 75th percentile; * p<0.0001 comparing overweight (BMI 25-30) and obese subjects (BMI >30) with those with BMI <25 (after adjusting for multiple comparisons). B: Circulating NEP increases across increasing quartiles of HOMA. Data presented as median and 75th percentile; * p<0.0001 comparing quartiles 3 and 4 with quartile 1 and for comparing quartile 2 with 4, and § p=0.006 comparing quartiles 3 with 4 (all after adjusting for multiple comparisons).
Figure 2
Figure 2. Relationships between NEP and the MetS in healthy subjects
A: NEP increased progressively with increasing number of MetS components p for trend <0.0001. Data presented as median NEP (75th percentile) (nmol/L); B: NEP ≥0.2028 nmol/L was independently associated with MetSIDF and sub-components. The cut point for NEP (≥0.2028 nmol/L) in relation to MetSIDF was determined from ROC curve analysis (inset). *P<0.0005 compared with individuals with no MetS components after adjustment for multiple comparisons. P<0.001 compared with individuals with one MetS component after adjustment for multiple comparisons.
Figure 3
Figure 3. NEP expression in the human adipocyte SGBS cells during differentiation
Total RNA and total protein were extracted from differentiating SGBS cells over a 0-14 day period every 2 days, starting at day 0. A: NEP gene expression was measured using semiquantitative real time PCR, with simultaneous amplification of GAPDH as an internal control allowing normalisation of target gene expression. Data represents the mean values observed in two independent experiments, with samples analysed in triplicate. Data are presented as a fold increase in NEP gene expression, relative to the undifferentiated SGBS cells (day 0) which was readily detectable (CT value approximately 25). B: NEP protein expression was measured using a semiquantitative western blot approach. Data are presented as a fold increase in mean ± SEM (n=3) intensity values of NEP, relative to the undifferentiated SGBS cells (day 0). C: Gene expression of NEP, adiponectin, retinol binding protein-4 (RBP4) and PAI-1 in 14 day differentiated SGBS cells determined by the Human Genome U133 Plus 2.0 array. Data from nine arrays are represented as mean ± SEM of the corresponding intensity signals derived by the GeneChip Operating Software. D: Western blot showing the increase in NEP protein concentration over the 14d differentiation period.
Figure 4
Figure 4. NEP plasma and tissue levels in a mouse model of high-fat diet (HFD) induced insulin resistance
A: After 7 and 15 weeks of diet, mice were bled from the lateral saphenous vein and NEP protein levels were measured. Grey bar: NCD-fed mice, white bar: HFD-fed mice. Results are presented as mean±SEM from n=8 mice. * p<0.05 vs. NCD, ** p<0.01 vs. NCD, # p<0.05 vs. HFD week 7. B: Tissues were harvested after 15 weeks of diet and NEP protein levels were measured in mesenteric adipose tissue (AT), epididymal AT, perirenal AT, liver, and kidney. Grey bar: NCD-fed, white bar: HFD-fed. NEP levels are expressed as a ratio of ng NEP to mg total protein. Data are presented as median and 25th and 75th percentile from n=8 mice. *p < 0.05 vs. NCD.
Figure 5
Figure 5. Metabolic characteristics of the NEPKO mouse under normal chow and high fat feeding regimes
Plasma glucose levels in response to intraperitoneal glucose administration (a, b) measured over 2 hours after 4 weeks (a) and 15 weeks (b) of feeding and in response to insulin administration (c,d) after 7 (c) and 20 (d) weeks of feeding; closed lines: NCF mice, dashed lines: HFF mice, open symbols: NEPKO, closed symbols WT littermates. There was no difference in response between NEPKO and WT. There was no change in e) body and fat pad weight after 20 weeks of feeding and f) weight of epididymal fat pads (expressed as % of total body weight); closed bars, wild type NCF, open bars, NEPKO NCF, horizontally striped bars WT HFF, vertically striped bars NEPKO HFF. In all parameters, HFF mice differed significantly from NCF mice (*p <0.05).

References

    1. Turner AJ, Isaac RE, Coates D. The neprilysin (NEP) family of zinc metalloendopeptidases: genomics and function. Bioessays. 2001;23(3):261–269. - PubMed
    1. Turner AJ. Neprilysin. In: Barret AJ, Rawlings ND, Woessner JF, editors. Handbook of Proteolytic Enzymes. Elsevier; Amsterdam: 2004. pp. 419–426.
    1. Corti R, Burnett JC, Jr., Rouleau JL, Ruschitzka F, Luscher TF. Vasopeptidase inhibitors: a new therapeutic concept in cardiovascular disease? Circulation. 2001;104(15):1856–1862. - PubMed
    1. Molinaro G, Rouleau JL, Adam A. Vasopeptidase inhibitors: a new class of dual zinc metallopeptidase inhibitors for cardiorenal therapeutics. Curr Opin Pharmacol. 2002;2(2):131–141. - PubMed
    1. Campbell DJ. Vasopeptidase inhibition: a double-edged sword? Hypertension. 2003;41(3):383–389. - PubMed

Publication types

MeSH terms