Review
. 2010 Dec;20(4):327-48.
doi: 10.1007/s11065-010-9148-4. Epub 2010 Nov 3.

The basics of brain development

Affiliations
Review

The basics of brain development

Joan Stiles et al. Neuropsychol Rev. 2010 Dec.

Abstract

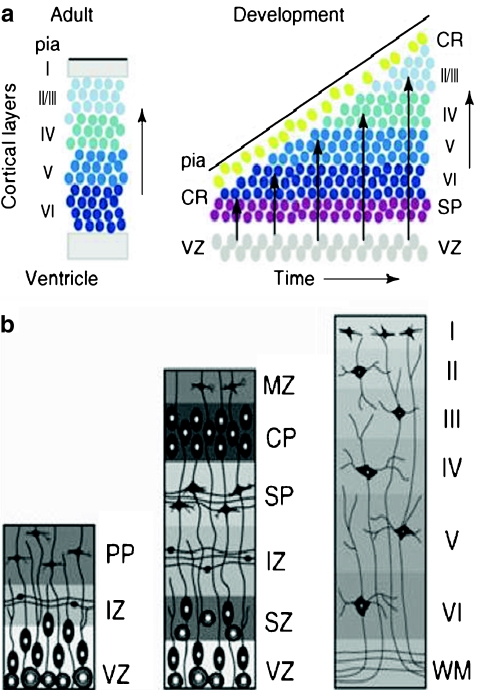
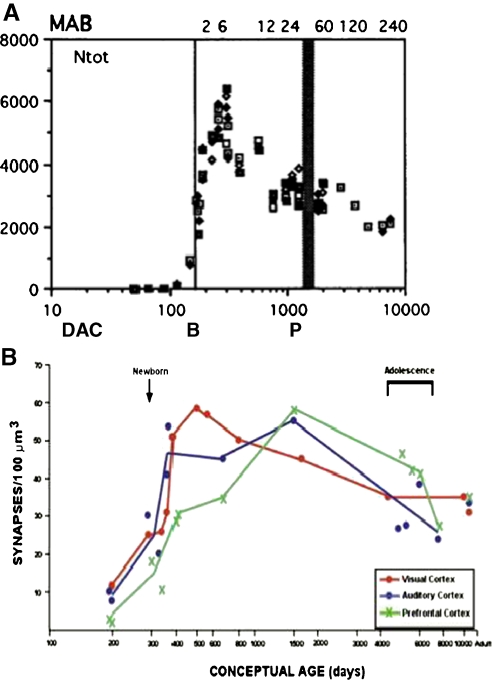
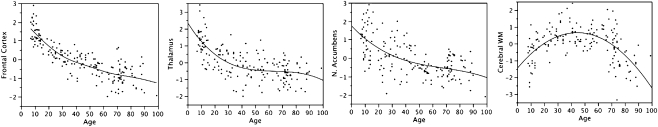
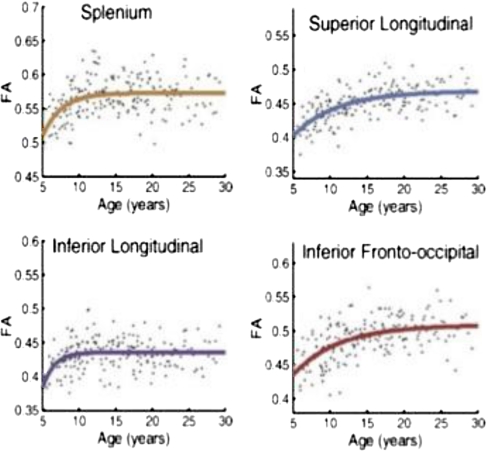
Over the past several decades, significant advances have been made in our understanding of the basic stages and mechanisms of mammalian brain development. Studies elucidating the neurobiology of brain development span the levels of neural organization from the macroanatomic, to the cellular, to the molecular. Together this large body of work provides a picture of brain development as the product of a complex series of dynamic and adaptive processes operating within a highly constrained, genetically organized but constantly changing context. The view of brain development that has emerged from the developmental neurobiology literature presents both challenges and opportunities to psychologists seeking to understand the fundamental processes that underlie social and cognitive development, and the neural systems that mediate them. This chapter is intended to provide an overview of some very basic principles of brain development, drawn from contemporary developmental neurobiology, that may be of use to investigators from a wide range of disciplines.


Figures

Fig. 1
Fig. 1
Human embryo at Carnegie Stage 23, the end of the embryonic period (GW8). It is 30 mm long. Image from the Kyoto Collection reproduced with permission of Prof Kohei Shiota, Graduate School of Medicine, Kyoto University, and obtained with permission of Dr. Mark Hill, University of New South Wales, http://embryology.med.unsw.edu.au/embryo.htm
Fig. 2
Fig. 2
Schematic drawing of a neuron. Each neuron a single large axon. At the distal tip of the axon is a growth cone that serves to guide the axon to targeted brain regions. Once the axon reaches the target site, synapses, or points of connection, form between the axon and the target neuron. The synapse allows electrochemical signals to be transmitted to the target neuron. Each neuron also has a complex arbor of dendrites that receive information from other neurons. Image in the public domain uploaded from: http://upload.wikimedia.org/wikipedia/commons/7/72/Neuron-figure-notext.svg. Original image from Nicolas Rougier
Fig. 3
Fig. 3
Two views of the human brain. a. Lateral view (rostral end is left, caudal is right) shows an apparently uniform surface marked by gyri and sulcal folds (Right hemisphere of J. Piłsudski’s brain, lateral view, image in the public domain). b. Coronal cross-section (cut at approximately the level of the dotted line in A) stained for cell bodies that mark neurons. The neocortex is the thin mantel layer (dark purple) on the surface of the brain. The white areas are connecting fiber pathways. Image reproduced with permission from http://www.brains.rad.msu.edu which is supported by the U.S. National Science Foundation. Images obtained with permission from Wiki Commons, http://commons.wikimedia.org/wiki
Fig. 4
Fig. 4
The major spatial dimensions of the E13 embryo. a. The dorsal surface view of the embryo on E13 is shown in the first panel. The wall of the amniotic sac has been cut away to reveal the dorsal surface (epiblast layer) of the embryo. The rostral (“head”) end of the embryo is on the top of this figure, and the caudal (“tail”) end is at the bottom. b. A lateral cross-section of the embryo and placenta at E13. On E13, the two-layered embryo is located centrally between two major placental sacs. The amniotic sac (which later in development will surround the embryo) is located above the embryo, and the yolk sac is located below. The rostral end of the embryo is to the right in this figure. To place the embryo shown in the first panel of A within the context of the lateral view of the embryo and placenta shown in B, it is necessary to first rotate the embryo so that the rostral end faces right (second panel of A), and then rotate the embryo in depth so that the dorsal surface faces up (last panel of A). C. The comparable rostral-caudal and dorsal-ventral spatial axes of an infant. The spatial axes of a crawling infant are comparable to the position of the embryo in B. Illustrations by Matthew Stiles Davis reprinted by permission of the publisher from THE FUNDAMENTALS OF BRAIN DEVELOPMENT: INTEGRATING NATURE AND NURTURE by Joan Stiles, Cambridge, Mass.: Harvard University Press, Copyright © 2008 by the President and Fellows of Harvard College
Fig. 5
Fig. 5
The major events of gastulation occur between E13 and E20. a. The onset of gastrulation is marked by the formation of the primitive streak and the primitive node. The primitive streak provides an opening to deeper embryonic layers. The primitive node is a critical molecular signaling center. On E13, cells from the epiblast layer begin to migrate toward the primitive node and streak (blue arrows). The dotted line indicates the cross-sectional view shown in panel B. b. The migrating cells first move to the primitive streak and then change direction and move down and under the upper layer (blue arrows). As the cells pass the node they receive molecular signals that induce gene expression in the migrating cells. By the end of gastrulation, the hypoblast layer is replaced by the newly formed endodermal layer and the epiblast layer by the ectodermal layer. Between these layers the mesodermal layer forms. c. Once under the upper layer, the cells change direction and begin migrating rostrally under the upper layer (blue arrows). The first cells to migrate form the most rostral regions of the newly forming endodermal and mesodermal layers. Later migrating cells form progressively more caudal regions of the layers. d. Cells that migrate along the axial midline send molecular signals that induce cells in the overlying epiblast layer to differentiate into neuroectodermal cells (red band) which are the neural progenitor cells. Migrating cells also receive a second set of signals from the node that induce anterior or posterior fate in different subpopulations of the neurectodermal cells. Early migrating cells signal anterior fate in the progenitor cells, while late migrating cells signal posterior fate. Illustrations by Matthew Stiles Davis reprinted by permission of the publisher from THE FUNDAMENTALS OF BRAIN DEVELOPMENT: INTEGRATING NATURE AND NURTURE by Joan Stiles, Cambridge, Mass.: Harvard University Press, Copyright © 2008 by the President and Fellows of Harvard College
Fig. 6
Fig. 6
Changes in the morphology of the embryo in the embryonic period. The formation of the neural tube occurs between E19 and E29. a. The emergence of the neural ridges is observed on E19. b. The ridges fold over to begin the process of neural tube formation. c. Closure of the neural tube begins on E22 in central regions of the newly forming neural tube. d. Closure continues in rostral and caudal direction. The anterior neuropore closes on E25, and the posterior on E27. e. Following the closure of the neural tube, the embryo begins to expand particularly in anterior regions. The primary vesicles are evident by E28. These include the Prosencephalon, Mesencephalon, and Rhombencephalon. f. By E49 the secondary vesicles emerge. The Prosencephalon differentiates into the Telencephalon and Diencephalon, and the Rhombencephalon into the Metencephalon and Myelencephalon. Illustrations by Matthew Stiles Davis reprinted by permission of the publisher from THE FUNDAMENTALS OF BRAIN DEVELOPMENT: INTEGRATING NATURE AND NURTURE by Joan Stiles, Cambridge, Mass.: Harvard University Press, Copyright © 2008 by the President and Fellows of Harvard College
Fig. 7
Fig. 7
The effects of different concentrations of Emx2 and Pax6 on the development of sensorimotor cortical areas. It is the combination of the specific concentration of each molecule that determines the identity of the cortical region. Mutations that affect the quantities of either molecule alter cortical patterning. Adapted with permission from Bishop et al. (2002). "Distinct actions of Emx1, Emx2, and Pax6 in regulating the specification of areas in the developing neocortex." J Neurosci 22(17): 7627–7638, Fig. 1
Fig. 8
Fig. 8
Different modes of neuronal migration to the neocortex. a. Neuron migration by somal translocation where cell extends a cytoplasmic process and attaches to the outside of the brain compartment (pial surface), and then the nucleus moves up into the brain area. b. Neuron migraton radial glial guide. Radial glial provides scaffold for neuron to migrate along. c. Neuron migration from second proliferative zone in ganglionic eminences by tangential migration (arrows indicate direction of migration for different neuron populations). Figures A and B adapted with permission from Nadarajah et al. (2003). Neuronal Migration in the Developing Cerebral Cortex: Observations Based on Real- time Imaging. Cerebral Cortex, 13, 607–611. Figure 5. Figure C adapted from illustrations by Matthew Stiles Davis reprinted by permission of the publisher from THE FUNDAMENTALS OF BRAIN DEVELOPMENT: INTEGRATING NATURE AND NURTURE by Joan Stiles, Cambridge, Mass.: Harvard University Press, Copyright © 2008 by the President and Fellows of Harvard College
Fig. 9
Fig. 9
a. The earliest produced neurons migrate to the deepest cortical layers (dark blue). Subsequently migrating neurons migrate to successively more superficial layers (lighter blues) creating an inside out order of migration. Adapted with permission from Cooper (2008). Trends in Neuroscience, 31(3), 113-19. b. As shown in the first panel, the first neurons migrate from the ventricular zone (VZ) to form the preplate (PP). As shown in the second panel, the next neurons split the PP into the marginal zone (MZ) an the subplate (SP), both transient brain structures. The mature brain, shown in the third panel, has six well developed cortical layers (I-VI), but none of the embryonic structures (MZ, SP, VZ). The intermediate zone (IZ) has become a mature white matter layer (WM). Illustrations by Matthew Stiles Davis reprinted by permission of the publisher from THE FUNDAMENTALS OF BRAIN DEVELOPMENT: INTEGRATING NATURE AND NURTURE by Joan Stiles, Cambridge, Mass.: Harvard University Press, Copyright © 2008 by the President and Fellows of Harvard College
Fig. 10
Fig. 10
Synaptic connectivity in the primate brain exhibits initial exuberant production followed by gradual pruning. a. In primate brain, the number of synaptic contacts per probe was plotted along a logarithmic scale as a function of days after conception (DAC). Months after birth (MAB) are indicated along the top of the graph, birth (B) at 166 days post conception is indicated by the thin vertical line and puberty (P) at 3–4 years by the thick vertical line. Reprinted with permission from Bourgeois and Rakic (1993). “Changes of synaptic density in the primary visual cortex of the macaque monkey from fetal to adult stage.” Journal of Neuroscience 13(7): 2801–2820, Fig. 3. b. In human brains, counts of the number of synapses per constant volume of tissue were measured as a function of pre- and postnatal age. Adapted with permission from Huttenlocher and Dabholkar (1997). Regional differences in synaptogenesis in human cerebral cortex. Journal of Comparative Neurology, 387, 167–178, Fig. 2
Fig. 11
Fig. 11
Estimated volumes of brain structures in normal volunteers are plotted against age. The volumes in the figures are presented as standardized residuals (removing variability associated with volume of the supratentorial cranial vault). They are, from left, volumes of frontal cortex, thalamus, nucleus accumbens, and cerebral white matter. Note the rapid age-related change (and striking individual differences) in the childhood and adolescent age-range. (Figures modified from Jernigan & Gamst, Neurobiology of Aging, 26 (9), 1271–1274, 2005)
Fig. 12
Fig. 12
Cross sectional data from Lebel et al. (, Lebel and Beaulieu 2009) showing robust FA increases in 4 major fiber tracts; note rapid change in FA in young school-aged children and variability in the pace at which FA in the different tracts approaches asymptote. Reprinted with permission from Lebel et al. (2008). “Microstructural maturation of the human brain from childhood to adulthood.” Neuroimage 40(3): 1044–1055
Fig. 13
Fig. 13
Individual trajectories for sequential measurements of FA in the genu of the corpus callosum (left) and the superior longitudinal fasciculus (SLF) (right), redrawn from Lebel et al. (, Lebel and Beaulieu 2009), illustrating individual differences
Fig. 14
Fig. 14
Autoradiographs of the ocular dominance columns (ODC) in two young monkeys. A radioactive transneuronal dye was injected into one eye and taken up by neurons in the input layer of primary visual cortex (PVC). a. The normal patterning of the ODC in a 6-week old monkey. ODCs from each eye are equal and adultlike. b. ODC patterning from an animal that was monocularly deprived at 2 weeks of age. The nondeprived eye was injected with the tracer at 18 months of age. ODC for the nondeprived eye (light bands) expand and while those of the deprived eye (dark bands) shrink showing clear dominance of the nondeprived eye in PVC. Adapted from LeVay et al. (1980). Journal of Comparative Neurology, 191, 1–51, Figs. 5 and 6

References

    1. Anderson SA, Marin O, et al. Distinct cortical migrations from the medial and lateral ganglionic eminences. Development. 2001;128(3):353–363. - PubMed
    1. Barkovich AJ. Concepts of myelin and myelination in neuroradiology. AJNR. American Journal of Neuroradiology. 2000;21(6):1099–1109. - PMC - PubMed
    1. Barkovich AJ. Magnetic resonance techniques in the assessment of myelin and myelination. Journal of Inherited Metabolic Disease. 2005;28(3):311–343. doi: 10.1007/s10545-005-5952-z. - DOI - PubMed
    1. Barnea-Goraly N, Menon V, et al. White matter development during childhood and adolescence: a cross-sectional diffusion tensor imaging study. Cerebral Cortex. 2005;15(12):1848–1854. doi: 10.1093/cercor/bhi062. - DOI - PubMed
    1. Basser PJ, Mattiello J, et al. MR diffusion tensor spectroscopy and imaging. Biophysical Journal. 1994;66(1):259–267. doi: 10.1016/S0006-3495(94)80775-1. - DOI - PMC - PubMed

Publication types