

The search for the hydrophobic force law
- PMID: 21043428
- PMCID: PMC3058852
- DOI: 10.1039/b926184b
The search for the hydrophobic force law
Abstract
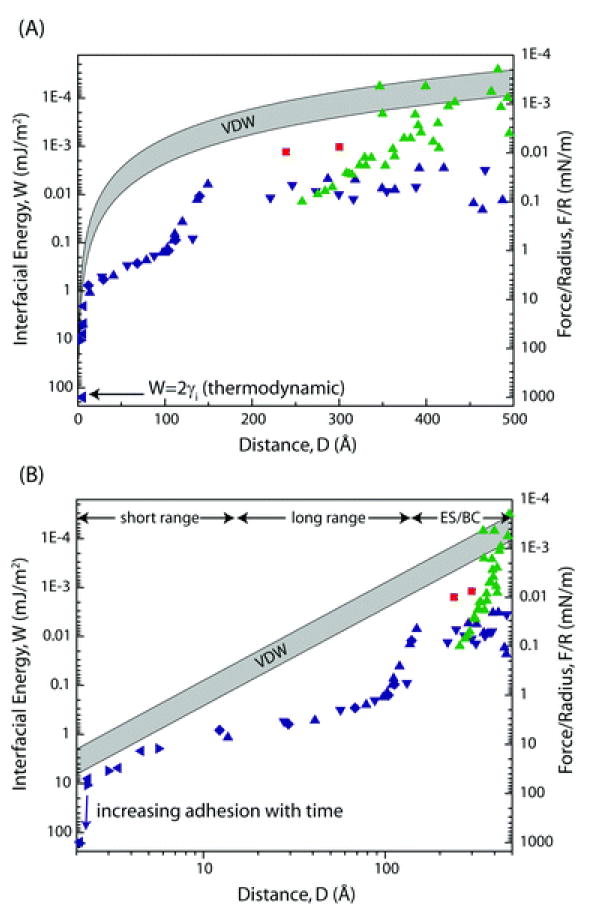
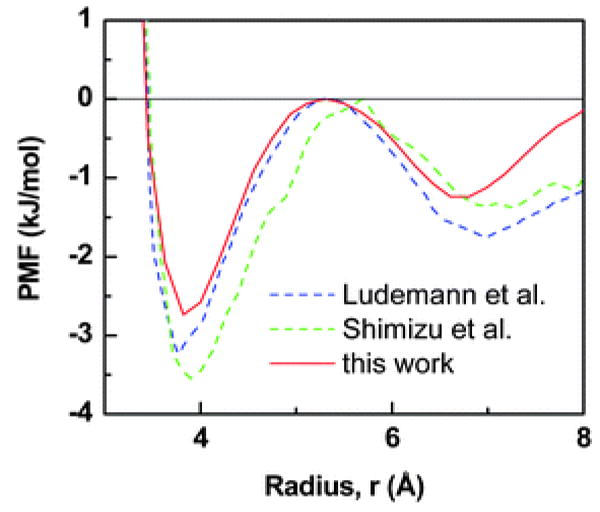
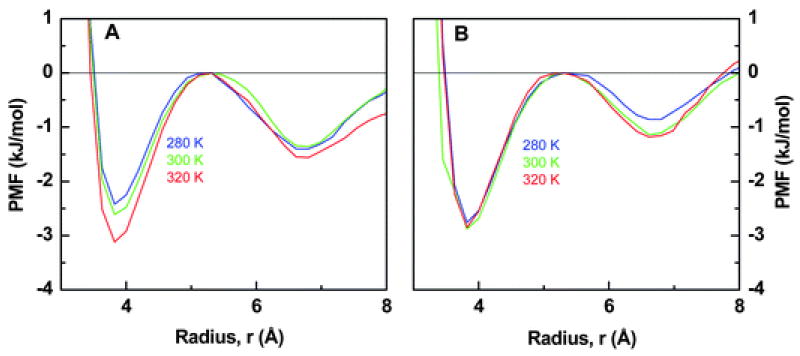
After nearly 30 years of research on the hydrophobic interaction, the search for the hydrophobic force law is still continuing. Indeed, there are more questions than answers, and the experimental data are often quite different for nominally similar conditions, as well as, apparently, for nano-, micro-, and macroscopic surfaces. This has led to the conclusion that the experimentally observed force-distance relationships are either a combination of different 'fundamental' interactions, or that the hydrophobic force-law, if there is one, is complex--depending on numerous parameters. The only unexpectedly strong attractive force measured in all experiments so far has a range of D approximately 100-200 angstroms, increasing roughly exponentially down to approximately 10-20 angstroms and then more steeply down to adhesive contact at D = 0 or, for power-law potentials, effectively at D approximately 2 angstroms. The measured forces in this regime (100-200 angstroms) and especially the adhesive forces are much stronger, and have a different distance-dependence from the continuum VDW force (Lifshitz theory) for non-conducting dielectric media. We suggest a three-regime force-law for the forces observed between hydrophobic surfaces: In the first, from 100-200 angstroms to thousands of angstroms, the dominating force is created by complementary electrostatic domains or patches on the apposing surfaces and/or bridging vapour cavities; a 'pure' but still not well-understood 'long-range hydrophobic force' dominates the second regime from approximately 150 to approximately 15 angstroms, possibly due to an enhanced Hamaker constant associated with the 'proton-hopping' polarizability of water; while below approximately 10-15 anstroms to contact there is another 'pure short-range hydrophobic force' related to water structuring effects associated with surface-induced changes in the orientation and/or density of water molecules and H-bonds at the water-hydrophobic interface. We present recent SFA and other experimental results, as well as a simplified model for water based on a spherically-symmetric potential that is able to capture some basic features of hydrophobic association. Such a model may be useful for theoretical studies of the HI over the broad range of scales observed in SFA experiments.
Figures
References
-
- Zhang XY, Zhu YX, Granick S. J Am Chem Soc. 2001;123(27):6736–6737. - PubMed
-
- Singh S, Houston J, van Swol F, Brinker CJ. Nature. 2006;442(7102):526–526. - PubMed
-
- Christenson HK, Claesson PM, Berg J, Herder PC. J Phys Chem. 1989;93(4):1472–1478.
-
- Christenson HK, Claesson PM, Parker JL. J Phys Chem. 1992;96(16):6725–6728.
Publication types
MeSH terms
Substances
Grants and funding
LinkOut - more resources
Full Text Sources
Other Literature Sources