

Blood flow and cell-free layer in microvessels
- PMID: 21044216
- PMCID: PMC3529161
- DOI: 10.1111/j.1549-8719.2010.00056.x
Blood flow and cell-free layer in microvessels
Abstract
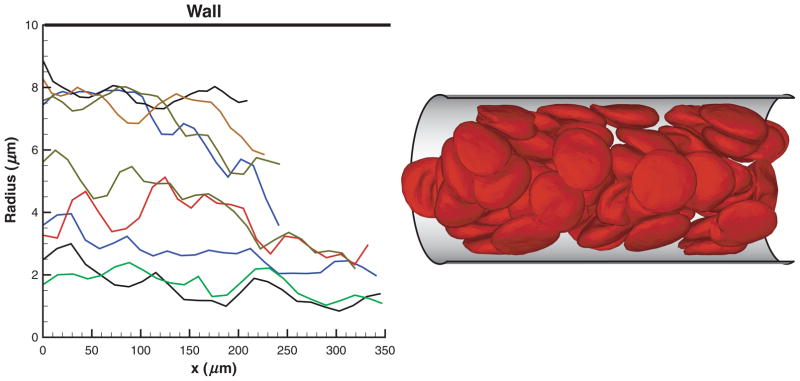
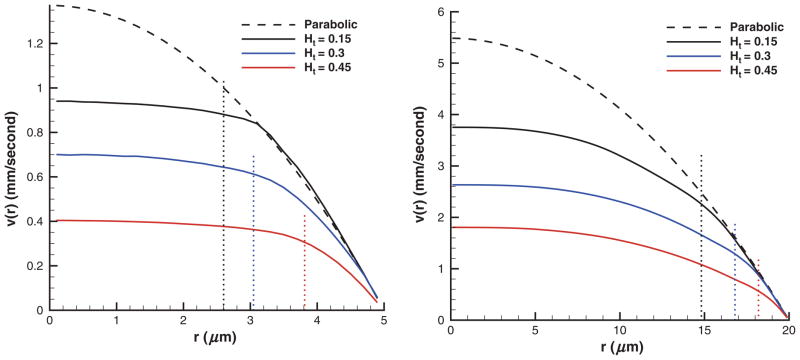
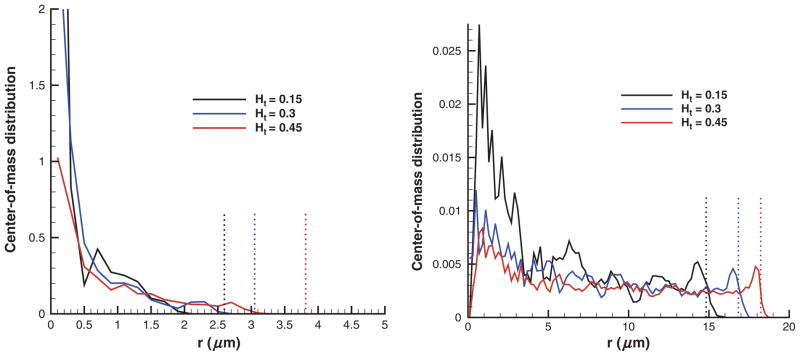
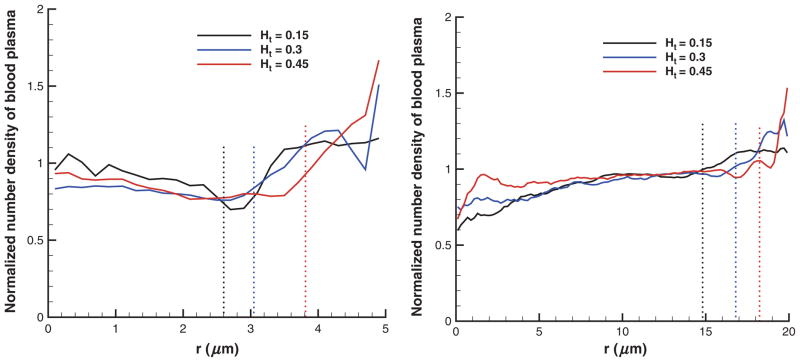
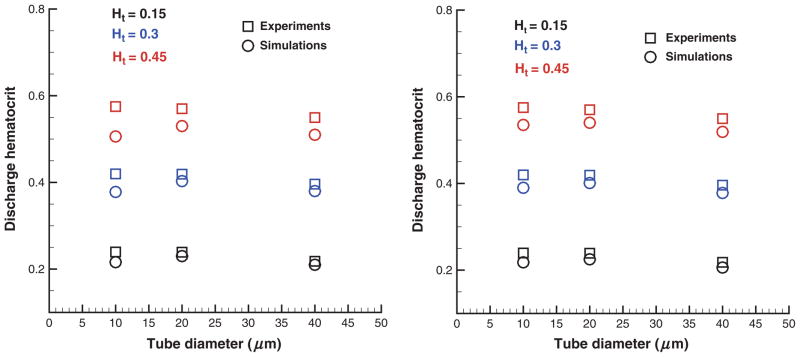
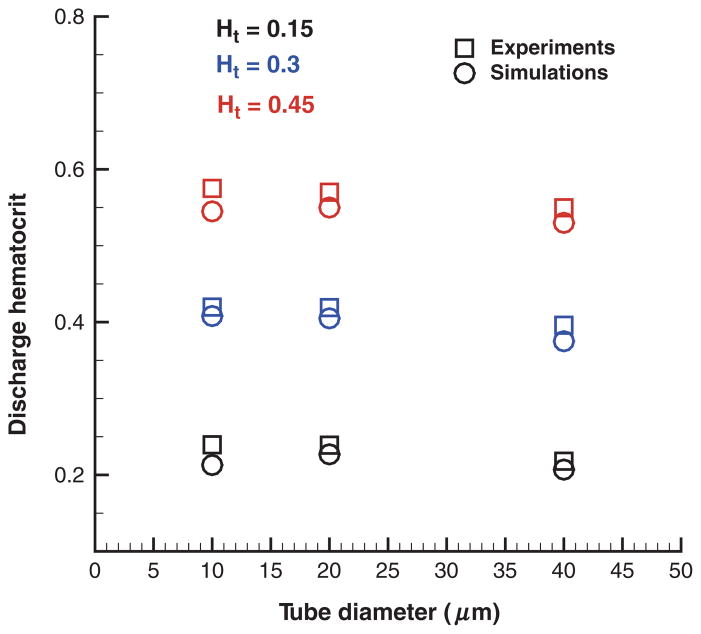
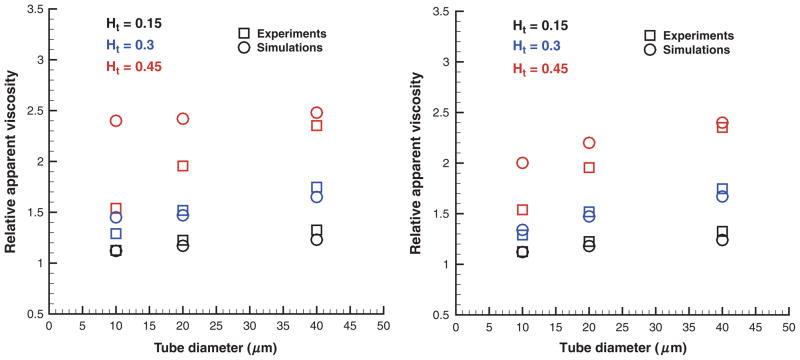
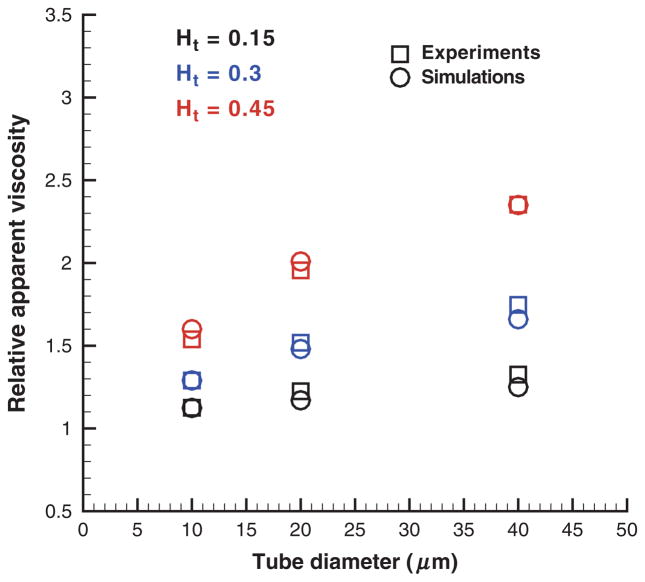
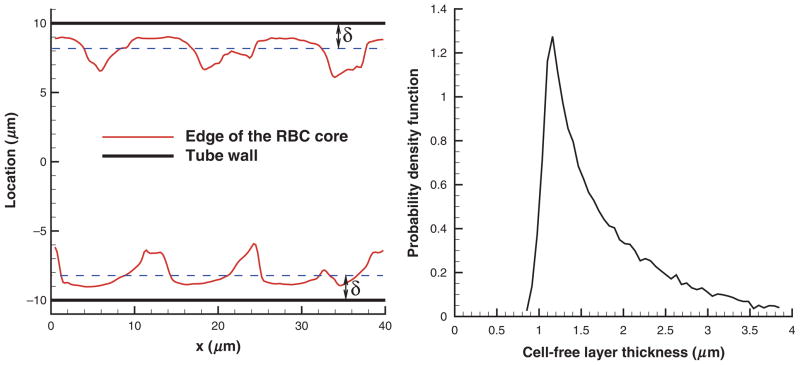
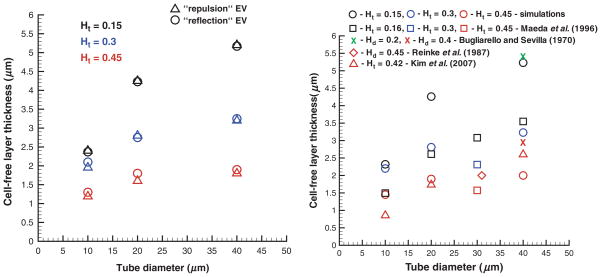
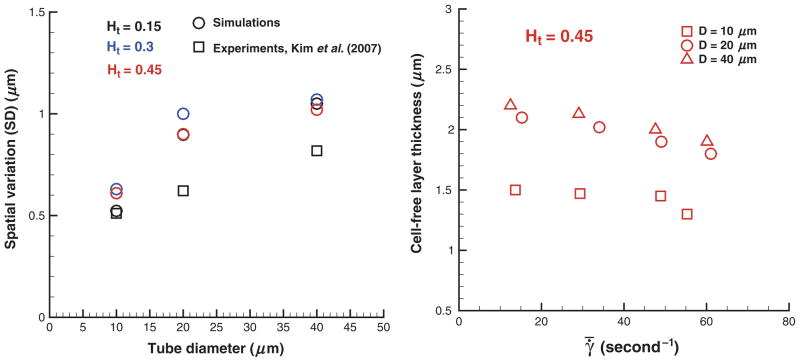
Blood is modeled as a suspension of red blood cells using the dissipative particle dynamics method. The red blood cell membrane is coarse-grained for efficient simulations of multiple cells, yet accurately describes its viscoelastic properties. Blood flow in microtubes ranging from 10 to 40 μm in diameter is simulated in three dimensions for values of hematocrit in the range of 0.15-0.45 and carefully compared with available experimental data. Velocity profiles for different hematocrit values show an increase in bluntness with an increase in hematocrit. Red blood cell center-of-mass distributions demonstrate cell migration away from the wall to the tube center. This results in the formation of a cell-free layer next to the tube wall corresponding to the experimentally observed Fahraeus and Fahraeus-Lindqvist effects. The predicted cell-free layer widths are in agreement with those found in in vitro experiments; the results are also in qualitative agreement with in vivo experiments. However, additional features have to be taken into account for simulating microvascular flow, e.g., the endothelial glycocalyx. The developed model is able to capture blood flow properties and provides a computational framework at the mesoscopic level for obtaining realistic predictions of blood flow in microcirculation under normal and pathological conditions.
© 2010 John Wiley & Sons Ltd.
Figures
Similar articles
-
Microvascular blood flow resistance: Role of red blood cell migration and dispersion.Microvasc Res. 2015 May;99:57-66. doi: 10.1016/j.mvr.2015.02.006. Epub 2015 Feb 25. Microvasc Res. 2015. PMID: 25724979
-
Mesoscale simulation of blood flow in small vessels.Biophys J. 2007 Mar 15;92(6):1858-77. doi: 10.1529/biophysj.106.095042. Epub 2007 Jan 5. Biophys J. 2007. PMID: 17208982 Free PMC article.
-
Dynamics of blood flow: modeling of Fåhraeus and Fåhraeus-Lindqvist effects using a shear-induced red blood cell migration model.J Biol Phys. 2018 Dec;44(4):591-603. doi: 10.1007/s10867-018-9508-5. Epub 2018 Sep 15. J Biol Phys. 2018. PMID: 30219980 Free PMC article.
-
The cell-free layer in microvascular blood flow.Biorheology. 2009;46(3):181-9. doi: 10.3233/BIR-2009-0530. Biorheology. 2009. PMID: 19581726 Review.
-
Dynamic structure of blood flow in microvessels.Microcirc Endothelium Lymphatics. 1991;7(1-3):3-49. Microcirc Endothelium Lymphatics. 1991. PMID: 1762608 Review.
Cited by
-
Assessment of Blood Biophysical Properties Using Pressure Sensing with Micropump and Microfluidic Comparator.Micromachines (Basel). 2022 Mar 13;13(3):438. doi: 10.3390/mi13030438. Micromachines (Basel). 2022. PMID: 35334730 Free PMC article.
-
Design and Utility of a Point-of-Care Microfluidic Platform to Assess Hematocrit and Blood Coagulation.Cell Mol Bioeng. 2018 Dec;11(6):519-529. doi: 10.1007/s12195-018-0541-z. Epub 2018 Jul 19. Cell Mol Bioeng. 2018. PMID: 31105798 Free PMC article.
-
Predicting different adhesive regimens of circulating particles at blood capillary walls.Microfluid Nanofluidics. 2017;21(11):168. doi: 10.1007/s10404-017-2003-7. Epub 2017 Oct 26. Microfluid Nanofluidics. 2017. PMID: 32009866 Free PMC article.
-
Two-dimensional simulation of red blood cell motion near a wall under a lateral force.Phys Rev E Stat Nonlin Soft Matter Phys. 2014 Nov;90(5-1):053014. doi: 10.1103/PhysRevE.90.053014. Epub 2014 Nov 24. Phys Rev E Stat Nonlin Soft Matter Phys. 2014. PMID: 25493888 Free PMC article.
-
Artificial Red Blood Cells as Potential Photosensitizers in Dye Laser Treatment Against Port-Wine Stains.J Funct Biomater. 2017 Apr 13;8(2):14. doi: 10.3390/jfb8020014. J Funct Biomater. 2017. PMID: 28406466 Free PMC article. Review.
References
-
- Bugliarello G, Sevilla J. Velocity distribution and other characteristics of steady and pulsatile blood flow in fine glass tubes. Biorheology. 1970;7:85–107. - PubMed
-
- Cokelet GR, Goldsmith HL. Decreased hydrodynamic resistance in the two-phase flow of blood through small vertical tubes at low flow rates. Circ Res. 1991;68:1–17. - PubMed
-
- Damiano ER. The effect of the endothelial-cell glycocalyx on the motion of red blood cells through capillaries. Microvasc Res. 1998;55:77–91. - PubMed
-
- Dao M, Li J, Suresh S. Molecularly based analysis of deformation of spectrin network and human erythrocyte. Mater Sci Eng C. 2006;26:1232–1244.
Publication types
MeSH terms
Grants and funding
LinkOut - more resources
Full Text Sources
