. 2010 Nov;17(8):629-40.
doi: 10.1111/j.1549-8719.2010.00059.x.

Development of an image-based system for measurement of membrane potential, intracellular Ca(2+) and contraction in arteriolar smooth muscle cells

Affiliations

Development of an image-based system for measurement of membrane potential, intracellular Ca(2+) and contraction in arteriolar smooth muscle cells

Srikanth R Ella et al. Microcirculation. 2010 Nov.

Abstract

Objective: Changes in smooth muscle cell (SMC) membrane potential (Em) are critical to vasomotor responses. As a fluorescent indicator approach would lessen limitations of glass electrodes in contracting preparations, we aimed to develop a Forster (or fluorescence) resonance energy transfer (FRET)-based measurement for Em.

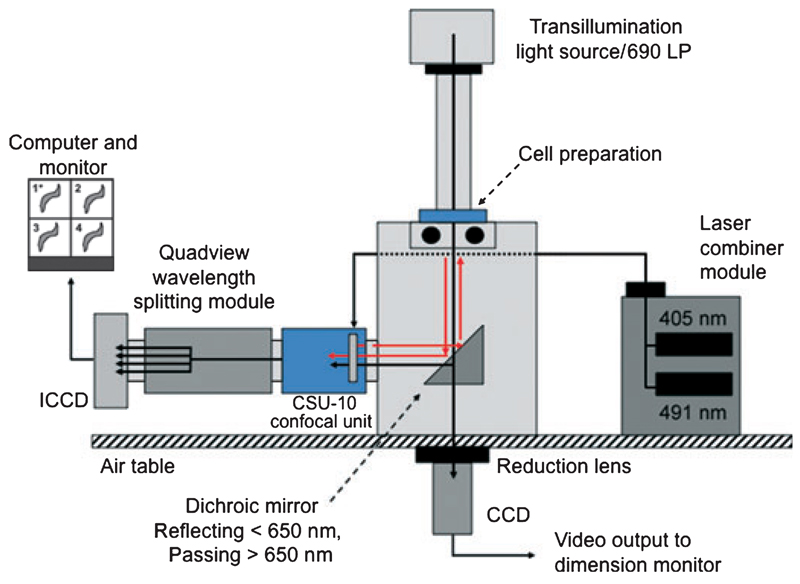
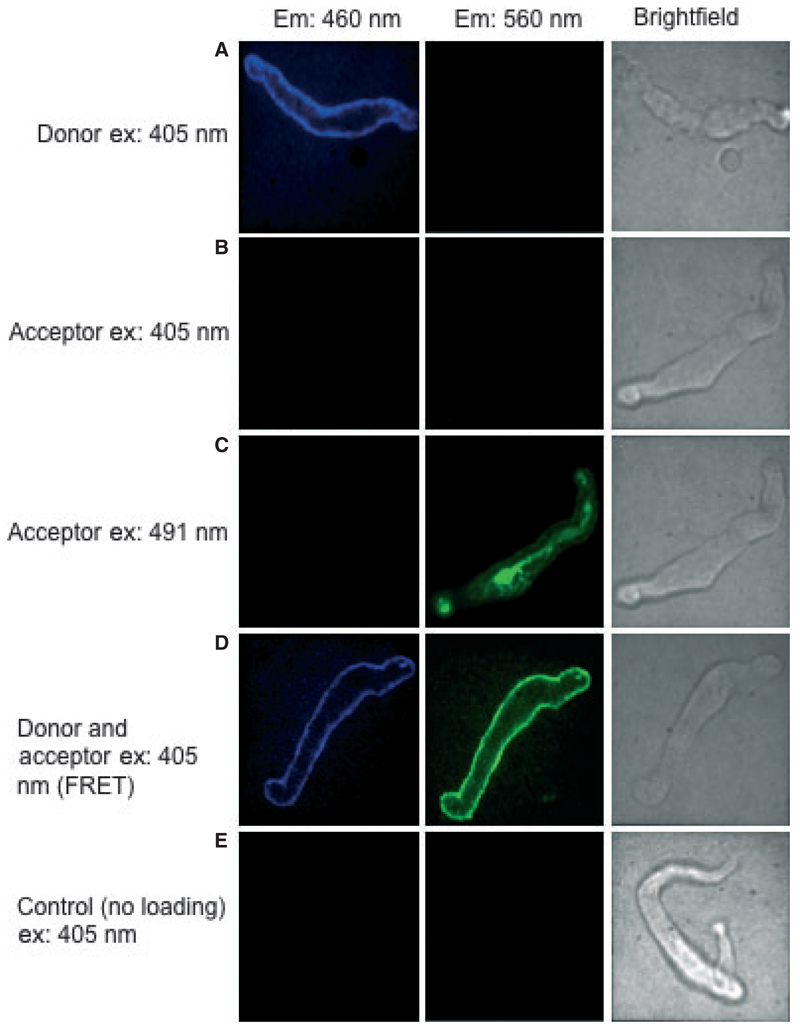
Methods: The FRET pair used in this study (donor CC2-DMPE [excitation 405 nm] and acceptor DisBAC(4) (3)) provide rapid measurements at a sensitivity not achievable with many ratiometric indicators. The method also combined measurement of changes in Ca(2+) (i) using fluo-4 and excitation at 490 nm.

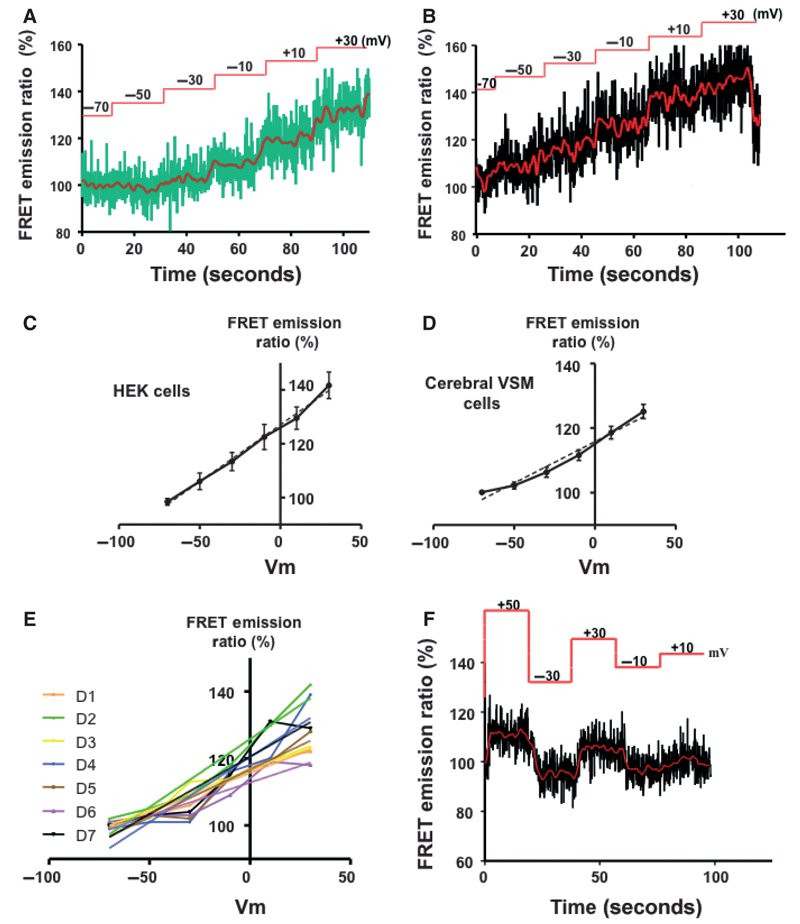
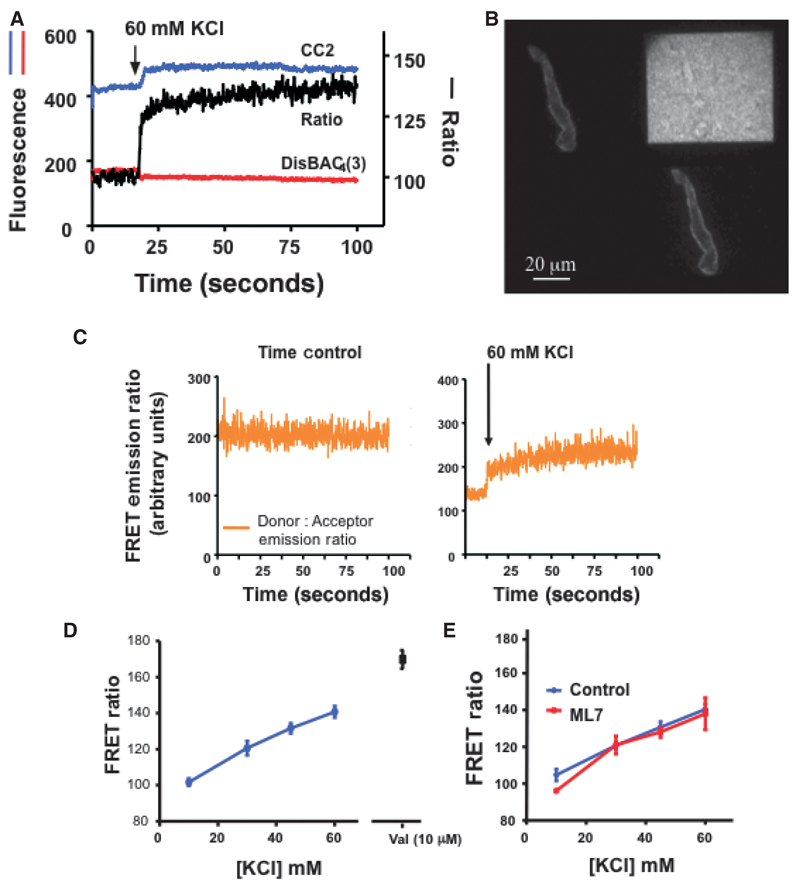
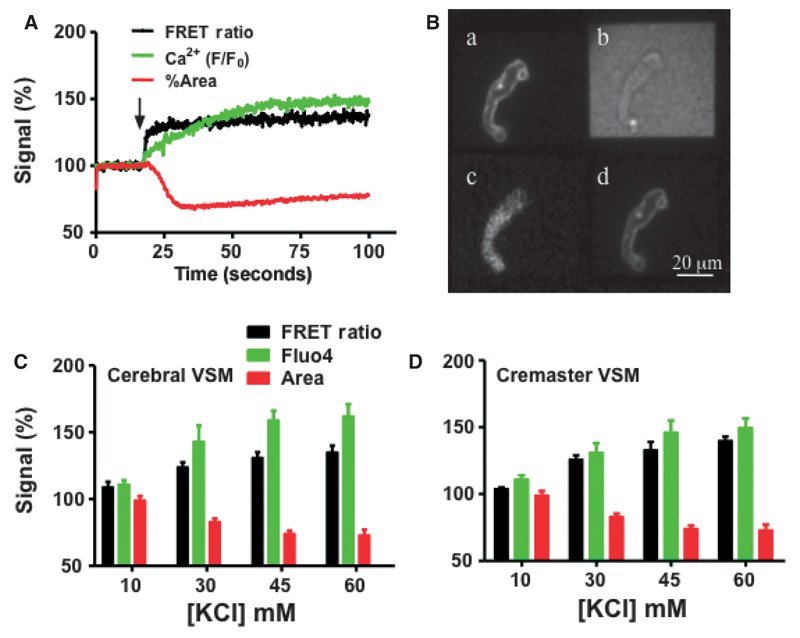
Results: After establishing loading conditions, a linear relationship was demonstrated between Em and fluorescence signal in FRET dye-loaded HEK cells held under voltage clamp. Over the voltage range from -70 to +30 mV, slope (of FRET signal vs. voltage, m) = 0.49 ± 0.07, r(2) = 0.96 ± 0.025. Similar data were obtained in cerebral artery SMCs, slope (m) = 0.30 ± 0.02, r(2) = 0.98 ± 0.02. Change in FRET emission ratio over the holding potential of -70 to +30 mV was 41.7 ± 4.9% for HEK cells and 30.0 ± 2.3% for arterial SMCs. The FRET signal was also shown to be modulated by KCl-induced depolarization in a concentration-dependent manner. Further, in isolated arterial SMCs, KCl-induced depolarization (60 mM) measurements occurred with increased fluo-4 fluorescence emission (62 ± 9%) and contraction (-27 ± 4.2%).

Conclusions: The data support the FRET-based approach for measuring changes in Em in arterial SMCs. Further, image-based measurements of Em can be combined with analysis of temporal changes in Ca(2+) (i) and contraction.


Figures

Figure 1.
Figure 1.
Schematic diagram illustrating the optical set-up used for measurement of membrane potential (Em), Ca2+i and image dimensions. ICCD, intensified charged couple device; CSU-10, confocal scanning unit. *(1) CC2-DMPE emission image; (2) wide field image; (3) fluo-4 emission image; (4) DisBAC4(3) emission image (FRET signal). See Supplementary material for additional detail of optical paths including dichroic mirrors and filters.
Figure 2.
Figure 2.
Demonstration of a specific FRET signal in freshly isolated cremaster smooth muscle cell (SMC). Cells were loaded with CC2-DMPE (donor; 5 µM) alone, DisBAC4(3) (acceptor; 3 μM) alone or a combination of the two molecules (for details see text). The figure shows pseudo-colored images (quadrants) taken from the original Quadview images. Excitation at 405 nm was shown to directly excite only the donor molecule (compare images in Rows A and B). In contrast, direct excitation of the acceptor was demonstrated with the 491 nm laser (Row C). In cells loaded with both fluorophores, FRET could be demonstrated following excitation at 405 nm (Row D). Control cells not loaded with either indicator showed no detectable fluorescence in response to excitation at 405 nm (Row E).
Figure 3.
Figure 3.
Demonstration of a linear relationship between membrane potential (from −70 to +30 mV) and fluorescent signal. Studies were performed in both HEK cells (A, C) and freshly isolated cerebral VSM cells (B, D). Membrane potential was clamped at given levels using whole cell patch clamp techniques. Example tracings are shown in A and B with the redline showing a smoothed/averaged representation of the raw signal. Smoothing was accomplished by averaging the four measurements either side of a given data point. Results in C and D provide the group data and are shown as mean ± SEM. The solid lines show simple interpolation between data points while the dotted lines represent a linear fit to the data sets (see text for further details). Panel E illustrates day-to-day consistency of measurements. Two lines are given for each data set; showing raw data and a linear fit. Panel F illustrates temporal relationships between step changes in membrane holding potential and the measured FRET signals and further shows that the signal was reversible and not dependent on sequential application of the voltage steps.
Figure 4.
Figure 4.
FRET-based Em measurements in cremaster VSM cells following depolarization with KCl. Panel A shows example signals obtained following stimulation of a VSM cell with 60 mM KCl. Signals of the two fluorochromes are given on the left hand axis and the calculated FRET emission ratio on the right. Panel B shows a representative image as viewed on the computer monitor. Panel C shows a time control demonstrating the stability of the emission and FRET ratio signals in the absence of stimulation; a KCl-stimulated cell from the same cell isolation is shown for comparison. Figure D shows group FRET ratio data (expressed as a percentage of baseline fluorescence levels) to increasing concentrations of KCl (n = 63 cells from nine preparations) and the ionophore valimomycin (10 μM; n = 7 cells from three preparations). Panel E illustrates that preventing contraction with ML-7 (10 µM) does not substantially alter the FRET ratio (% baseline) signaling compared to that in the absence of the inhibitor (n = 4 cells in each group). Group data are shown as mean ± SEM.
Figure 5.
Figure 5.
Membrane potential (Em), Ca2+ and cell image cross-sectional area (measure of contraction) responses to increasing concentrations of KCl. (A) representative trace of a cremaster SMC showing responses to 60 mM KCl applied at the arrow. For each signal data have been normalized such that baseline values equal 100%. (B) shows a merged picture of images collected following sequential 405 and 491 nm excitation. Panels A and D show the donor and acceptor fluorescence emission, respectively, in response to excitation at 405 nm. Panel C shows fluo-4 emission following excitation at 491 nm while Panel B shows the transmitted light image. (C and D) Group data showing responses of cremaster cerebral SMC, respectively. Steady-state data were calculated for each signal and normalized such that baseline values equaled 100%. Individual data points for each KCl concentration were obtained by averaging the final 5 seconds of the recording period as shown in A. For these grouped data results are shown as mean ± SEM.

Similar articles

Cited by

References

    1. Beach JM, McGahren ED, Xia J, Duling BR. Ratiometric measurement of endothelial depolarization in arterioles with a potential-sensitive dye. Am J Physiol. 1996;270:H2216–2227. - PubMed
    1. Brueggemann LI, Markun DR, Henderson KK, Cribbs LL, Byron KL. Pharmacological and electrophysiological characterization of store-operated currents and capacitative Ca(2+) entry in vascular smooth muscle cells. J Pharmacol Exp Ther. 2006;317:488–499. - PubMed
    1. Burgstahler R, Koegel H, Rucker F, Tracey D, Grafe P, Alzheimer C. Confocal ratiometric voltage imaging of cultured human keratinocytes reveals layer-specific responses to ATP. Am J Physiol Cell Physiol. 2003;284:C944–952. - PubMed
    1. Burns WR, Cohen KD, Jackson WF. K+-induced dilation of hamster cremasteric arterioles involves both the Na+/K+-ATPase and inward-rectifier K+ channels. Microcirculation. 2004;11:279–293. - PMC - PubMed
    1. Chen Y, Rivers RJ. Measurement of membrane potential and intracellular Ca(2+) of arteriolar endothelium and smooth muscle in vivo. Microvasc Res. 2001;62:55–62. - PubMed

MeSH terms