. 2010 Nov 2:6:7.
doi: 10.1186/1745-7580-6-7.

An integrated approach to epitope analysis I: Dimensional reduction, visualization and prediction of MHC binding using amino acid principal components and regression approaches

Affiliations

An integrated approach to epitope analysis I: Dimensional reduction, visualization and prediction of MHC binding using amino acid principal components and regression approaches

Robert D Bremel et al. Immunome Res. .

Abstract

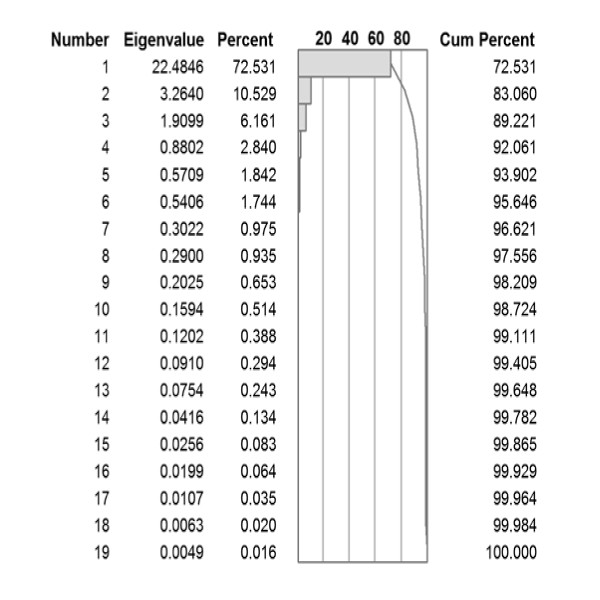
Background: Operation of the immune system is multivariate. Reduction of the dimensionality is essential to facilitate understanding of this complex biological system. One multi-dimensional facet of the immune system is the binding of epitopes to the MHC-I and MHC-II molecules by diverse populations of individuals. Prediction of such epitope binding is critical and several immunoinformatic strategies utilizing amino acid substitution matrices have been designed to develop predictive algorithms. Contemporaneously, computational and statistical tools have evolved to handle multivariate and megavariate analysis, but these have not been systematically deployed in prediction of MHC binding. Partial least squares analysis, principal component analysis, and associated regression techniques have become the norm in handling complex datasets in many fields. Over two decades ago Wold and colleagues showed that principal components of amino acids could be used to predict peptide binding to cellular receptors. We have applied this observation to the analysis of MHC binding, and to derivation of predictive methods applicable on a whole proteome scale.

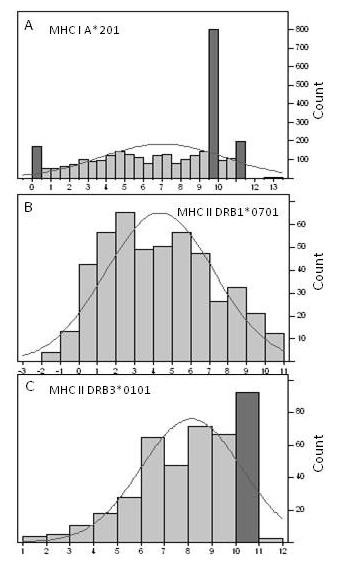
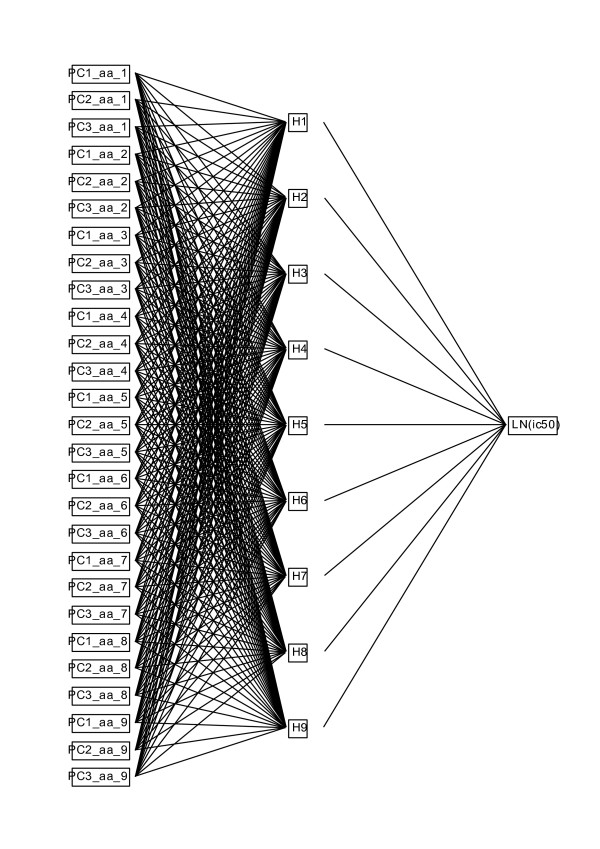
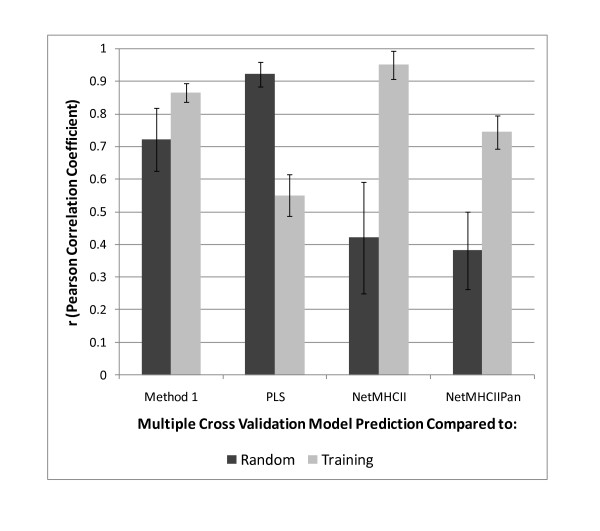
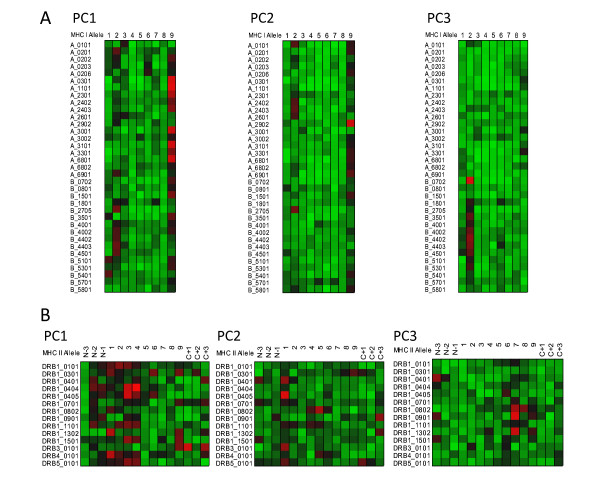
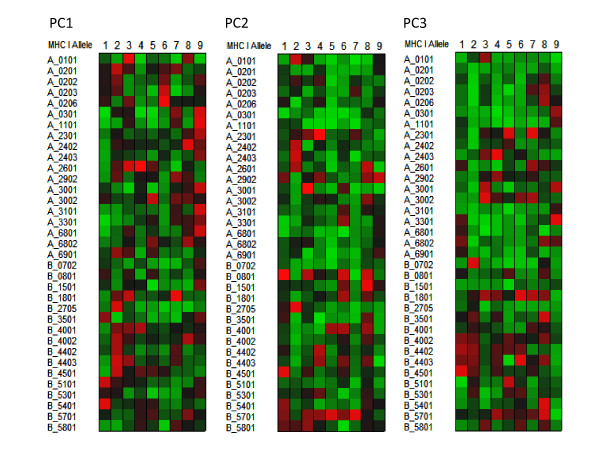
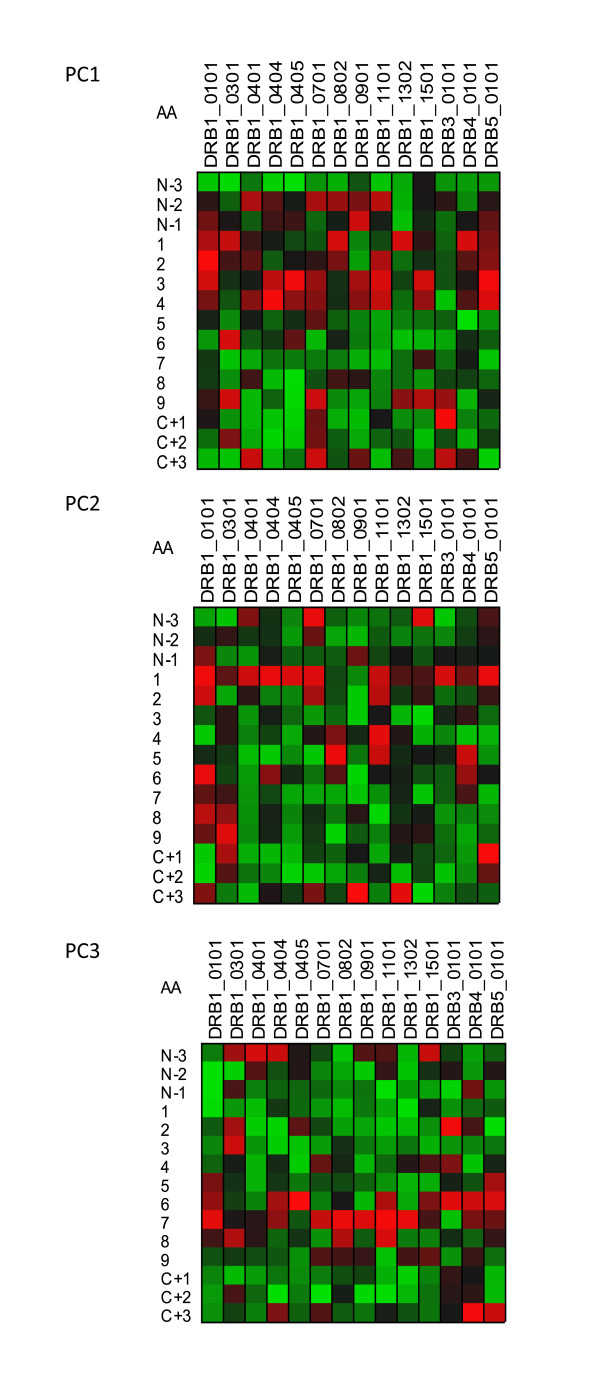
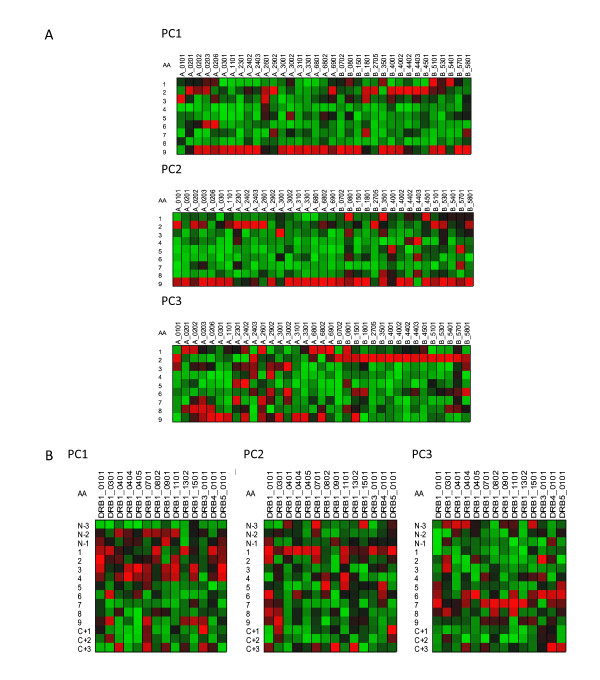
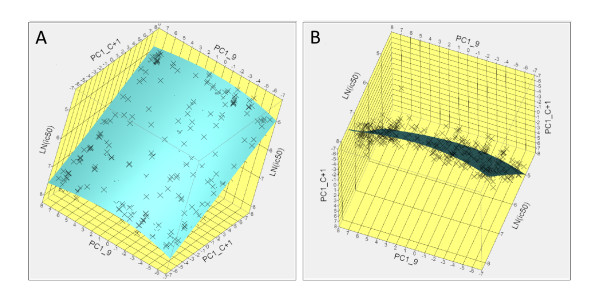
Results: We show that amino acid principal components and partial least squares approaches can be utilized to visualize the underlying physicochemical properties of the MHC binding domain by using commercially available software. We further show the application of amino acid principal components to develop both linear partial least squares and non-linear neural network regression prediction algorithms for MHC-I and MHC-II molecules. Several visualization options for the output aid in understanding the underlying physicochemical properties, enable confirmation of earlier work on the relative importance of certain peptide residues to MHC binding, and also provide new insights into differences among MHC molecules. We compared both the linear and non-linear MHC binding prediction tools to several predictive tools currently available on the Internet.

Conclusions: As opposed to the highly constrained user-interaction paradigms of web-server approaches, local computational approaches enable interactive analysis and visualization of complex multidimensional data using robust mathematical tools. Our work shows that prediction tools such as these can be constructed on the widely available JMP® platform, can operate in a spreadsheet environment on a desktop computer, and are capable of handling proteome-scale analysis with high throughput.


Figures

Figure 1
Figure 1
Principal component analysis of 31 different studies estimating different physical properties of amino acids.
Figure 2
Figure 2
Representative distributional properties of ln(ic50) binding data in the MHC-I and MHC-II benchmark data sets. (A) MHC-I A201, (B) MHC-II DRB1*0701 and (C) DRB3*0101. The dark bars in the histogram contain a preponderance of identical ic50 binding measurements. The curve is a normal distribution fit to the particular dataset. x axis = ln(ic50). Count is the number of peptides in the particular bin of the histogram.
Figure 3
Figure 3
Layout of the multilayer perceptron neural net used for prediction of MHC binding. The perceptron has a single input layer of the amino acid principal components, a hidden layer with a number of nodes equal to the binding domain, and a single output layer the natural logarithm of the ic50.
Figure 4
Figure 4
Comparisons of different prediction schemes for prediction of MHC-II binding affinity. Comparison of the perfomance of 3 different NN predictors and PLS with the IEDB training set and a random set of 15-mer peptides drawn from the proteome of Staphylococcus aureus COL. The mean estimate of the NN described as Method 2 in the text is used as the base comparator. Comparisons are based on the Pearson correlation coefficient (r) of the predicted ln(ic50) as a metric. The error bar is the standard deviation of the r obtained for the 14 different MHC-II alleles. See Additional File 7; Table S5 for detail.
Figure 5
Figure 5
Visualization of peptide binding to MHC-I and MHC-II. Variable importance projection (VIP) of the PLS regression prediction of ln(ic50) of peptide binding by using the first three principal components of the amino acids in each of the amino acids in the 9-mer as predictors for MHC-I (5A)and 15-mer for MHC-II (5B). Coloration is uniform over all cells in the matrix for each principal component (a copy of this figure with details of color scaling can be found in Additional File 8; Figure S5). The colors compare the relative importance of the particular numbered residue of the binding domain among all of the MHC alleles indicated. (PC1) Principal component 1 (polarity correlate), (PC2) Principal component 2 (size correlate), and (PC3) Principal component 3 (elctronic correlate). Cells in the matrix with VIP >1 are the most relevant in explaining the binding affinity. The particular MHC allele in each row is indicated on the left. A 9 amino acid binding domain is shown using the standard for the MHC binding groove numbered N-terminus to C-terminus 1 through 9 for MHC-I. A 15 amino acid binding domain is shown using the standard for the MHC-II binding groove numbered N-terminus to C-terminus 1 through 9 flanked by 3 amino acids on the N-terminus and C-terminus.
Figure 6
Figure 6
Visualization of the contribution of the different physical properties of amino acid to the peptide binding to MHC-I. Variable importance projection (VIP) of the PLS regression prediction of ln(ic50) of peptide binding by using the first three principal components of the amino acids in each of the amino acids in the 9-mer as predictors (PC1) Principal component 1, polarity correlate; (PC2) principal compent 2, size correlate, (PC3) principal component 3, electronic correlate. The colors compare the relative importance of the particular numbered residue of the binding domain among the MHC-I alleles indicated. Cells in the matrix with VIP >1 are the most relevant in explaining the binding affinity. Coloration is column-relative for each position in the binding domain (a copy of this figure with details of color scaling can be found in Additional File 8; Figure S6). The particular MHC-I allele in each row is indicated on the left. A 9 amino acid binding domain is shown using the standard for the MHC binding groove numbered N-terminus to C-terminus 1 through 9.
Figure 7
Figure 7
Visualization of the contribution of the different physical properties of amino acid to the peptide binding to MHC-II. Variable importance projection (VIP) of the PLS regression prediction of ln(ic50) of peptide binding using the first three principal components of each of the amino acids in the 15-mer as predictors. (PC1) Principal component 1, polarity correlate; (PC2) principal compent 2, size correlate, (PC3) principal component 3, electronic correlate. Coloration is column-relative indicated by the scales for each position in the binding domain (a copy of this figure with details of color scaling can be found in Additional File 8; Figure S7). The amino acid in the binding domain of the particular MHC-II allele in each column is indicated on the left. A 15-amino acid binding domain is shown using the standard for the MHC binding groove numbered N-terminus to C-terminus 1 through 9 along with the additional 3 N-terminal and 3 C-terminal residues. The colors compare the relative importance of the particular numbered residue of the binding domain among the MHC-II alleles indicated. Cells in the matrix with VIP >1 are the most relevant in explaining the binding affinity.
Figure 8
Figure 8
Visualization of the contribution of different residues in MHC binding. Variable importance projection (VIP) of the PLS regression prediction of ln(ic50) of peptide binding using the first three principal components of each of the amino acids in the 9-mer as predictors (PC1) Principal component 1, polarity correlate; (PC2) principal compent 2, size correlate, (PC3) principal component 3, electronic correlate. Coloration is column-relative indicated by the scales for each position in the binding (a copy of this figure with details of color scaling can be found in Additional File 8; Figure S8). The colors compare the relative importance of the particular numbered residue of the binding domain among the MHC-I alleles indicated. Cells in the matrix with VIP >1 are the most relevant in explaining the binding affinity. The amino acid in the binding domain of the particular MHC-I allele (A) or MHC-II (B) in each column is indicated on the left. A 9 amino acid binding domain is shown using the standard for the MHC binding groove numbered N-terminus to C-terminus 1 through 9. For MHC-II three additional amino acids are added to each the N-terminus and C-Terminus.
Figure 9
Figure 9
Example of visualization of physicochemical interactions between the peptide and the binding pocket of DRB3*0101. Potential effects of physicochemical interactions on the binding affinity can be explored interactively for all combinations of peptide amino acid and binding groove domain. (A) Inter-relationship of principal property 1 (hydrophobicity) for positions P9 and P(C+1). (B) rotation of the hyperplane of (A) to show the scatter of the residuals of the fit about this hyperplane.

Similar articles

Cited by

References

    1. Wold S, Sjorstrom M, Eriksson L. PLS-regression: a basic tool of chemometrics. Chemometrics and Intelligent Laboratory Systems. 2001;58:109–130. doi: 10.1016/S0169-7439(01)00155-1. - DOI
    1. Eriksson L, Johansson E, Kettaneh-Wold N, Trygg J, Wikstrom C, Wold S. Multi and Megavariate Data Analysis. Part II: Advanced Appplications and Method Extensions. 2. Umetrics Academy, Umea, Sweden; 2006.
    1. Eriksson L, Johansson E, Kettaneh-Wold N, Trygg J, Wikstrom C, Wold S. Multi and Megavariate Data Analysis. Part I: Basic Principles and Applications. 2. Umetrics Academy, Umea, Sweden; 2006.
    1. Doytchinova IA, Walshe V, Borrow P, Flower DR. Towards the chemometric dissection of peptide--HLA-A*0201 binding affinity: comparison of local and global QSAR models. J Comput Aided Mol Des. 2005;19:203–212. doi: 10.1007/s10822-005-3993-x. - DOI - PubMed
    1. Flower DR, McSparron H, Blythe MJ, Zygouri C, Taylor D, Guan P, Wan S, Coveney PV, Walshe V, Borrow P, Doytchinova IA. Computational vaccinology: quantitative approaches. Novartis Found Symp. 2003;254:102–120. full_text. - PubMed

LinkOut - more resources