

Beneficial laggards: multilevel selection, cooperative polymorphism and division of labour in threshold public good games
- PMID: 21044340
- PMCID: PMC2989973
- DOI: 10.1186/1471-2148-10-336
Beneficial laggards: multilevel selection, cooperative polymorphism and division of labour in threshold public good games
Abstract
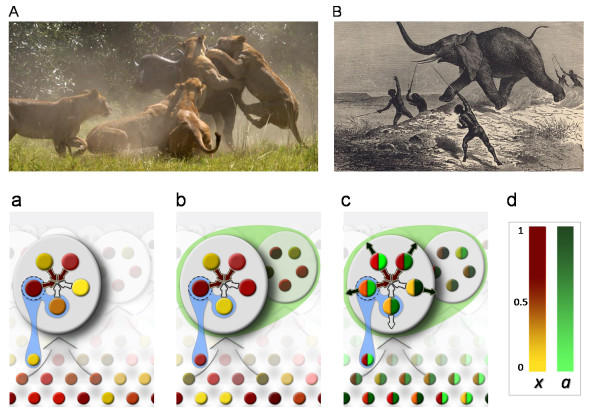
Background: The origin and stability of cooperation is a hot topic in social and behavioural sciences. A complicated conundrum exists as defectors have an advantage over cooperators, whenever cooperation is costly so consequently, not cooperating pays off. In addition, the discovery that humans and some animal populations, such as lions, are polymorphic, where cooperators and defectors stably live together--while defectors are not being punished--, is even more puzzling. Here we offer a novel explanation based on a Threshold Public Good Game (PGG) that includes the interaction of individual and group level selection, where individuals can contribute to multiple collective actions, in our model group hunting and group defense.
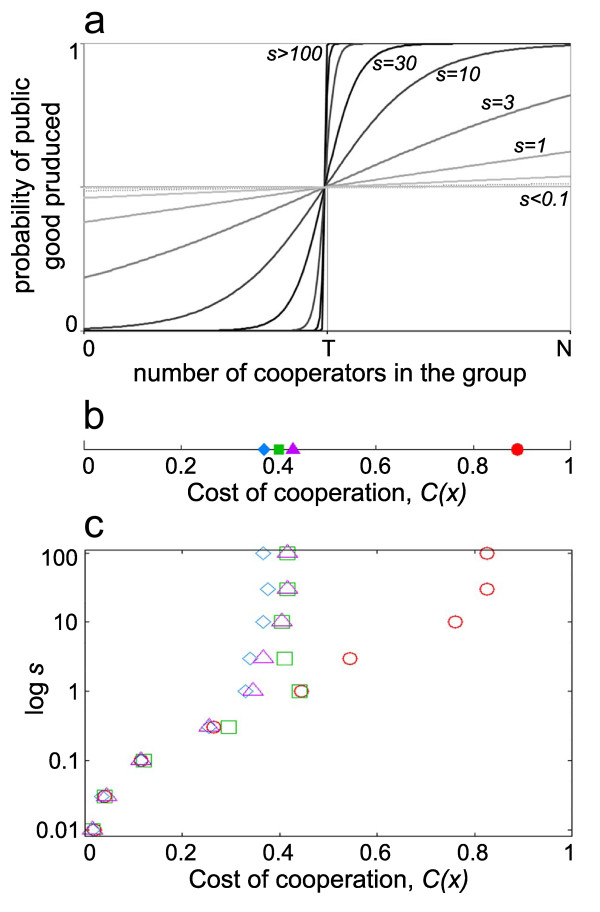
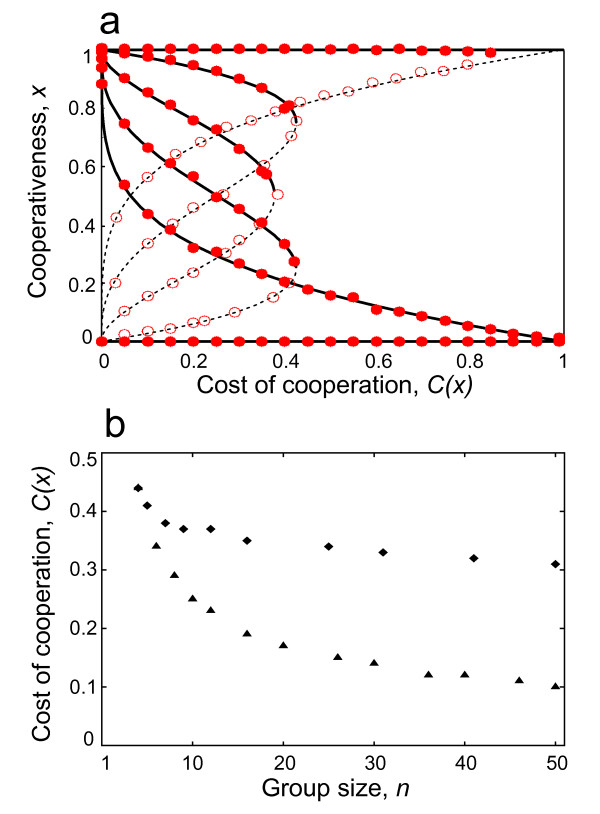
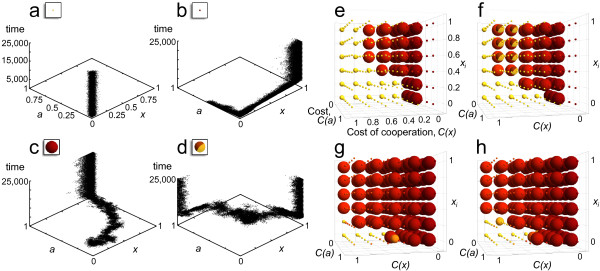
Results: Our results show that there are polymorphic equilibria in Threshold PGGs; that multi-level selection does not select for the most cooperators per group but selects those close to the optimum number of cooperators (in terms of the Threshold PGG). In particular for medium cost values division of labour evolves within the group with regard to the two types of cooperative actions (hunting vs. defense). Moreover we show evidence that spatial population structure promotes cooperation in multiple PGGs. We also demonstrate that these results apply for a wide range of non-linear benefit function types.
Conclusions: We demonstrate that cooperation can be stable in Threshold PGG, even when the proportion of so called free riders is high in the population. A fundamentally new mechanism is proposed how laggards, individuals that have a high tendency to defect during one specific group action can actually contribute to the fitness of the group, by playing part in an optimal resource allocation in Threshold Public Good Games. In general, our results show that acknowledging a multilevel selection process will open up novel explanations for collective actions.
Figures

Similar articles
-
Cue-driven microbial cooperation and communication: evolving quorum sensing with honest signaling.BMC Biol. 2024 Apr 2;22(1):73. doi: 10.1186/s12915-024-01857-6. BMC Biol. 2024. PMID: 38561772 Free PMC article.
-
Weak selection helps cheap but harms expensive cooperation in spatial threshold dilemmas.J Theor Biol. 2022 Mar 7;536:110995. doi: 10.1016/j.jtbi.2021.110995. Epub 2021 Dec 31. J Theor Biol. 2022. PMID: 34979105
-
The evolution of n-player cooperation-threshold games and ESS bifurcations.J Theor Biol. 2006 Jan 21;238(2):426-34. doi: 10.1016/j.jtbi.2005.06.007. Epub 2005 Jul 20. J Theor Biol. 2006. PMID: 16045941
-
Review: Game theory of public goods in one-shot social dilemmas without assortment.J Theor Biol. 2012 Apr 21;299:9-20. doi: 10.1016/j.jtbi.2011.06.018. Epub 2011 Jun 24. J Theor Biol. 2012. PMID: 21723299 Review.
-
Evolutionary dynamics in structured populations.Philos Trans R Soc Lond B Biol Sci. 2010 Jan 12;365(1537):19-30. doi: 10.1098/rstb.2009.0215. Philos Trans R Soc Lond B Biol Sci. 2010. PMID: 20008382 Free PMC article. Review.
Cited by
-
Adaptive and bounded investment returns promote cooperation in spatial public goods games.PLoS One. 2012;7(5):e36895. doi: 10.1371/journal.pone.0036895. Epub 2012 May 16. PLoS One. 2012. PMID: 22615836 Free PMC article.
-
Rewards and the evolution of cooperation in public good games.Biol Lett. 2014 Jan 29;10(1):20130903. doi: 10.1098/rsbl.2013.0903. Print 2014 Jan. Biol Lett. 2014. PMID: 24478200 Free PMC article.
-
Confrontational scavenging as a possible source for language and cooperation.BMC Evol Biol. 2011 Sep 20;11:261. doi: 10.1186/1471-2148-11-261. BMC Evol Biol. 2011. PMID: 21933413 Free PMC article.
-
Task syndromes: linking personality and task allocation in social animal groups.Behav Ecol. 2021 Feb 6;32(1):1-17. doi: 10.1093/beheco/araa083. eCollection 2021 Jan-Feb. Behav Ecol. 2021. PMID: 33708004 Free PMC article. Review.
-
How insurance affects altruistic provision in threshold public goods games.Sci Rep. 2015 Mar 13;5:9098. doi: 10.1038/srep09098. Sci Rep. 2015. PMID: 25765206 Free PMC article.
References
-
- Trivers R. The evolution of reciprocal altruism. Q Rev Biol. 1971;46:35–57. doi: 10.1086/406755. - DOI
-
- Axelrod R. The Evolution of Cooperation. New York, NY: Basic Books; 1984.
-
- Maynard Smith J, Szathmáry E. The Major Transitions in Evolution. Oxford: Freeman & Co; 1995.
Publication types
MeSH terms
Grants and funding
LinkOut - more resources
Full Text Sources
