. 2010 Oct 28;11 Suppl 9(Suppl 9):S2.
doi: 10.1186/1471-2105-11-S9-S2.

Mapping transcription mechanisms from multimodal genomic data

Affiliations

Mapping transcription mechanisms from multimodal genomic data

Hsun-Hsien Chang et al. BMC Bioinformatics. .

Abstract

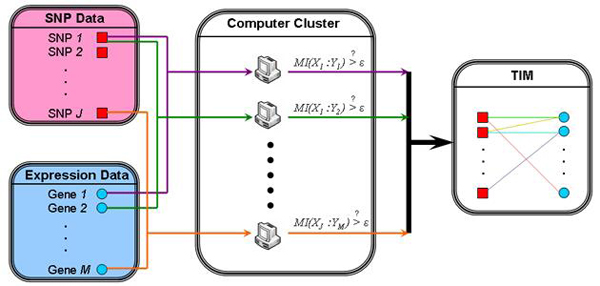
Background: Identification of expression quantitative trait loci (eQTLs) is an emerging area in genomic study. The task requires an integrated analysis of genome-wide single nucleotide polymorphism (SNP) data and gene expression data, raising a new computational challenge due to the tremendous size of data.

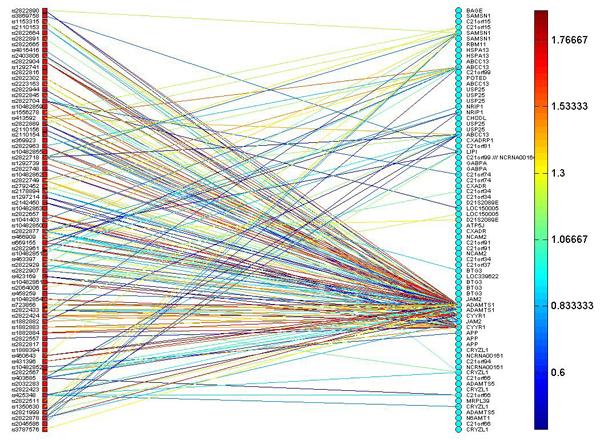
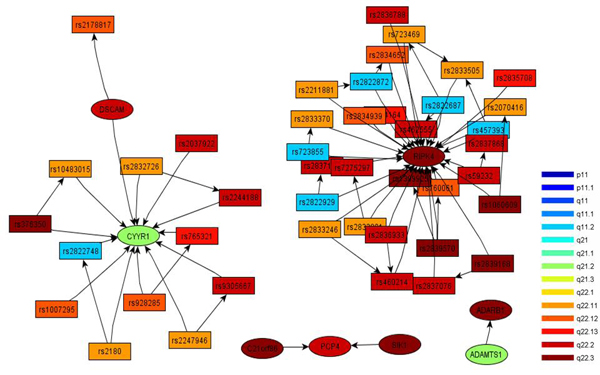
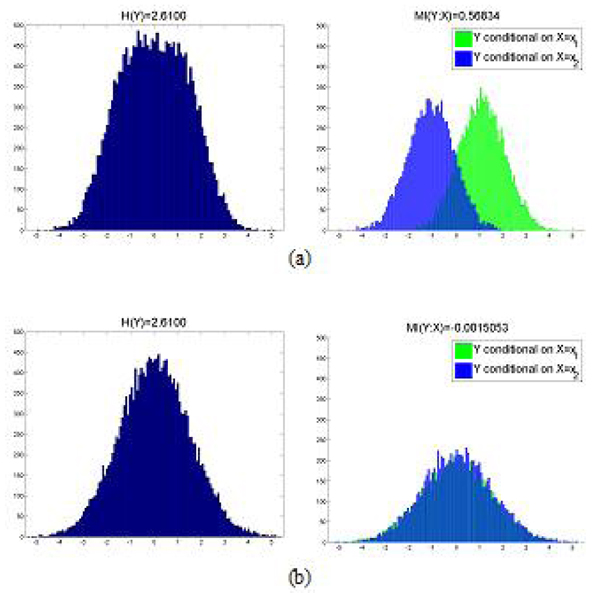
Results: We develop a method to identify eQTLs. The method represents eQTLs as information flux between genetic variants and transcripts. We use information theory to simultaneously interrogate SNP and gene expression data, resulting in a Transcriptional Information Map (TIM) which captures the network of transcriptional information that links genetic variations, gene expression and regulatory mechanisms. These maps are able to identify both cis- and trans- regulating eQTLs. The application on a dataset of leukemia patients identifies eQTLs in the regions of the GART, PCP4, DSCAM, and RIPK4 genes that regulate ADAMTS1, a known leukemia correlate.

Conclusions: The information theory approach presented in this paper is able to infer the dependence networks between SNPs and transcripts, which in turn can identify cis- and trans-eQTLs. The application of our method to the leukemia study explains how genetic variants and gene expression are linked to leukemia.


Figures

Figure 1
Figure 1
The TIM mapping SNPs on chromosome 21q11 and genes on chromosome 21q11-q22. The red squares denote SNPs, and blue circles denote genes. This map displays existing transcriptional channels, represented by the straight lines. The color of each line represents the signal strength of each channel as measured by mutual information.
Figure 2
Figure 2
Four cis/trans subnetworks abstracted from the TIM containing ADAMTS1. These networks explain that there are 4 crucial cis and trans regulatory mechanisms centered at RIPK4, CYYR1, PCP4, and ADAMTS1. Colors encode the cytobands of the SNPs and genes.
Figure 3
Figure 3
Illustration of mutual information between discrete and continuous variables. (a) The expression level of gene Y is modulated by a SNP X. The distribution of Y alone is a Gaussian with entropy H(Y)=2.61. When conditional on SNP X, the gene Y is a bimodal Gaussian whose mutual information with SNP X is H(Y:X)=0.57. (b) The gene Y and SNP X are independent. Although gene Y follows a Gaussian distribution and its entropy is the same as the entropy in (a), its distribution conditional on SNP X remains a unimodal Gaussian and its mutual information with SNP X is H(Y:X)=0.
Figure 4
Figure 4
The distributed computing system to construct a TIM from a set of SNP and gene expression data. Each computer in the cluster is responsible for calculating a portion of the TIM. Once the mutual information of a SNP-gene pair is computed, it is immediately used to determine if the pair is independent, and the mutual information is only recorded for dependent pairs. Finally, consolidation of all computed mutual information values generates a complete TIM.

Similar articles

Cited by

References

    1. Nica AC, Dermitzakis ET. Using gene expression to investigate the genetic basis of complex disorders. Hum Mol Genet. 2008;17(R2):R129–R134. doi: 10.1093/hmg/ddn285. - DOI - PMC - PubMed
    1. Mackay TFC, Stone EA, Ayroles JF. The genetics of quantitative traits: challenges and prospects. Nat Rev Genet. 2009;10(8):565–577. doi: 10.1038/nrg2612. - DOI - PubMed
    1. Huang RS, Duan S, Kistner EO, Zhang W, Bleibel WK, Cox NJ, Dolan ME. Identification of genetic variants and gene expression relationships associated with pharmacogenes in humans. Pharmacogenet Genomics. 2008;18(6):545–549. doi: 10.1097/FPC.0b013e3282fe1745. - DOI - PMC - PubMed
    1. Morley M, Weber CM, JL D, Ewens KG, Spielman RS, Cheung VG. Genetic Analysis of Genome-wide variation in human gene expression. Nature. 2004;430:743–747. doi: 10.1038/nature02797. - DOI - PMC - PubMed
    1. Cheung VG, Spielman RS, Ewens KG, Weber TM, Morley M, Burdick JT. Mapping determinants of human gene expression by regional and genome-wide association. Nature. 2005;437(7063):1365–1369. doi: 10.1038/nature04244. - DOI - PMC - PubMed

Publication types

LinkOut - more resources