. 2010 Nov 3;99(9):2717-25.
doi: 10.1016/j.bpj.2010.08.024.

A mathematical framework for analyzing T cell receptor scanning of peptides

Affiliations

A mathematical framework for analyzing T cell receptor scanning of peptides

Andreas Jansson. Biophys J. .

Abstract

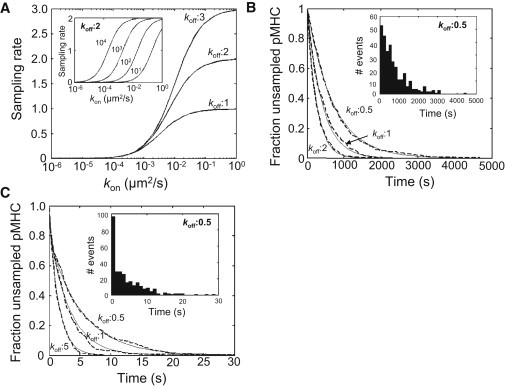
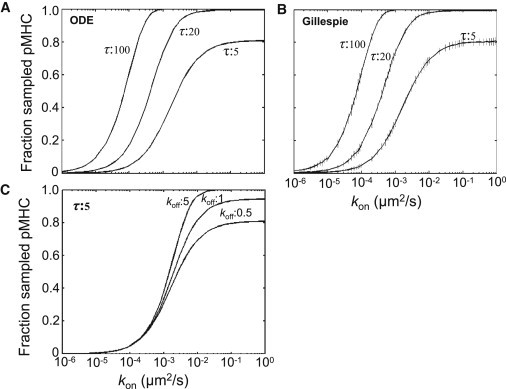
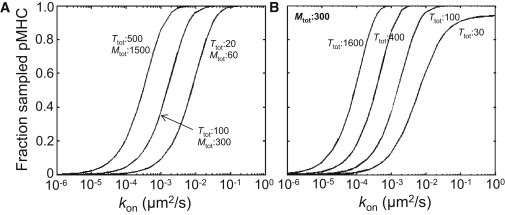
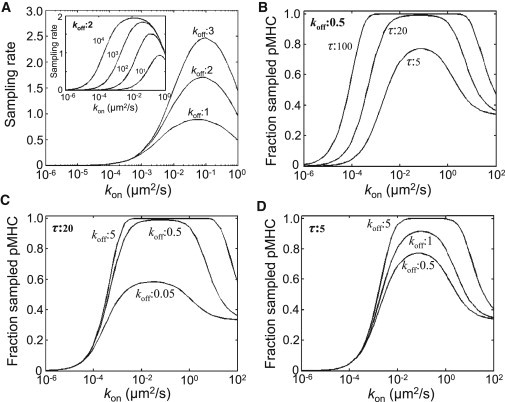
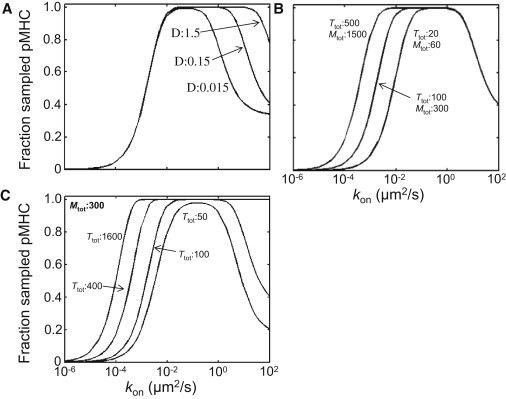
T cells continuously search for antigenic peptides presented on major histocompatibility complexes expressed on nearly all nucleated cells. Because only a few antigenic peptides are presented in a sea of thousands of self-peptides, the T cells have a critical task in discriminating between self- and nonself-peptides. This search process for antigens must be performed with sufficient speed in order to induce a fast response against invading pathogens. This study presents a mathematical framework for analyzing the scanning process of peptides. The framework includes analytic expressions for calculating the sampling rate as well as continuous-systems- and stochastic-agent-based models. The results show that the scanning of self-peptides is a very fast process due to fast off-rates. The simulations also predict the existence of an optimal sampling rate for a certain range of on-rates based on the recently proposed confinement time model. Calculations reveal that most of the self-peptides located within a microdomain are scanned within just a few seconds, and that the T cell receptors have kinetics for self-peptides, facilitating fast scanning. The derived mathematical expressions within this study provide conceptual calculations for further investigations of how the T cell discriminates between self- and nonself-peptides.


Figures

Figure 1
Figure 1
(A) Sampling rate as a function of k¯onvalues calculated with one TCR and 300 pMHC molecules/μm2. (Inset) Effect of different densities of pMHC molecules. (B and C) Fraction unsampled pMHC molecules within a microdomain as a function of time (Mtot = 300 molecules/μm2; k¯on= 0.01 μm2/s) simulated with one TCR/μm2 (B) or with 100 TCRs/μm2 (C). Continuous model simulations (solid lines) are compared with one stochastic simulation (dashed lines) with the corresponding parameter values. (Insets) Time at which unsampled pMHC molecules bind to a TCR from one representative stochastic simulation.
Figure 2
Figure 2
Fraction of sampled pMHC molecules within a microdomain after τ seconds as a function of k¯onvalues, with Ttot = 100 and Mtot = 300 molecules/μm2. (A) Simulation obtained with the ODE system (Eqs. 4 And 5) with different scan time values (τ = 5–100 s) at a koff value of 0.5/s. (B) Mean values of the corresponding stochastic simulation as in panel A, where the error bars represent the standard deviation from 50 repeats. (C) The effect of koff values is shown with a scan time of 5 s.
Figure 3
Figure 3
Fraction of sampled pMHC molecules within a microdomain after 5 s (τ = 5 s) as a function of k¯onvalues, with a koff value of 5/s is calculated with the ODE system (Eqs. 4 And 5). (A) Effect of different densities of both the interacting molecules. (B) The effect of changing only the TCR density.
Figure 4
Figure 4
Results obtained with the confinement time model. (A) Calculations of the sampling rate of the analytic expression (Eq. 11) as a function of k¯onvalues with different off-rates at a density of 300 pMHC molecules/μm2. (Inset) Effect of different densities of pMHC molecules. (BD) Simulations obtained with the ODE system (Eqs. 13–16) where the fraction of sampled pMHC within a microdomain as a function of k¯onvalues is shown (Ttot = 100; Mtot = 300 molecules/μm2; DT = 0.1; DM = 0.05 μm2/s). Effect of scan time (B) and koff values with a scan time of 20 s (C) and 5 s (D).
Figure 5
Figure 5
Results obtained with the confinement time model (Eqs. 13–16). The simulations show the fraction of sampled pMHC molecules within a microdomain as a function of k¯onvalues (koff = 5/s; DT = 0.1; DM = 0.05 μm2/s; τ = 5 s). (A) Effect of varying the diffusivities for TCR and pMHC molecules 10-fold where D represents the sum of DT and DM. (B) Results obtained by varying the densities of both molecules 10-fold. (C) The effect of changing the TCR density separately.

Similar articles

Cited by

References

    1. Mahajan V.S., Leskov I.B., Chen J.Z. Homeostasis of T cell diversity. Cell. Mol. Immunol. 2005;2:1–10. - PubMed
    1. Alam S.M., Travers P.J., Gascoigne N.R. T-cell-receptor affinity and thymocyte positive selection. Nature. 1996;381:616–620. - PubMed
    1. Stoll S., Delon J., Germain R.N. Dynamic imaging of T cell-dendritic cell interactions in lymph nodes. Science. 2002;296:1873–1876. - PubMed
    1. Miller M.J., Hejazi A.S., Parker I. T cell repertoire scanning is promoted by dynamic dendritic cell behavior and random T cell motility in the lymph node. Proc. Natl. Acad. Sci. USA. 2004;101:998–1003. - PMC - PubMed
    1. Irvine D.J., Purbhoo M.A., Davis M.M. Direct observation of ligand recognition by T cells. Nature. 2002;419:845–849. - PubMed

Publication types

LinkOut - more resources