. 2011 Jan 15;505(2):213-25.
doi: 10.1016/j.abb.2010.10.021. Epub 2010 Oct 31.

Subunit dissociation and metal binding by Escherichia coli apo-manganese superoxide dismutase

Affiliations

Subunit dissociation and metal binding by Escherichia coli apo-manganese superoxide dismutase

Mei M Whittaker et al. Arch Biochem Biophys. .

Abstract

Metal binding by apo-manganese superoxide dismutase (apo-MnSOD) is essential for functional maturation of the enzyme. Previous studies have demonstrated that metal binding by apo-MnSOD is conformationally gated, requiring protein reorganization for the metal to bind. We have now solved the X-ray crystal structure of apo-MnSOD at 1.9Å resolution. The organization of active site residues is independent of the presence of the metal cofactor, demonstrating that protein itself templates the unusual metal coordination geometry. Electrophoretic analysis of mixtures of apo- and (Mn₂)-MnSOD, dye-conjugated protein, or C-terminal Strep-tag II fusion protein reveals a dynamic subunit exchange process associated with cooperative metal binding by the two subunits of the dimeric protein. In contrast, (S126C) (SS) apo-MnSOD, which contains an inter-subunit covalent disulfide-crosslink, exhibits anti-cooperative metal binding. The protein concentration dependence of metal uptake kinetics implies that protein dissociation is involved in metal binding by the wild type apo-protein, although other processes may also contribute to gating metal uptake. Protein concentration dependent small-zone size exclusion chromatography is consistent with apo-MnSOD dimer dissociation at low protein concentration (K(D)=1×10⁻⁵ M). Studies on metal uptake by apo-MnSOD in Escherichia coli cells show that the protein exhibits similar behavior in vivo and in vitro.


Figures

Figure 1
Figure 1
Organization of the E. coli Mn2-MnSOD holo-protein. The homodimeric protein is shown with the metal ion rendered as a cyan sphere, and surrounding amino acid residues comprising the metal environment (His26, His81, Gln146, Asp167, His171) shown in space-filling view (purple). Individual subunits are color-coded (red and green), and one subunit surface is rendered transparent to reveal the internal architecture. (A) View perpendicular to molecular 2-fold axis. Inset expands the view of the metal environment. (B) View parallel to molecular 2-fold axis. (Based on PDB ID: 1VEW; visualized using CHIMERA [12]).
Figure 2
Figure 2
Structure of the metal binding site in apo-MnSOD. The active site of apo-MnSOD is shown with four of the active site residues displayed as sticks and labeled (active site residue Asp167 is omitted for clarity). The active site water molecule is shown as a light blue sphere, and is within hydrogen-bonding distance from Gln146, Asp167, and His171. Manganese, superposed from the holo-MnSOD structure (PDB ID: 1VEW), is shown as a magenta sphere for reference, but was not present in the apo crystals. A 2mFo−DFc electron density map is shown as a blue mesh at a contour level of 1.0σ surrounding the atoms in the active site. (Based on PDB ID: 3OT7. The image was generated using PyMOL [40].)
Figure 3
Figure 3
Time dependence of in vitro metal uptake by apo-MnSOD. MnSOD standards prepared by incubating equal amounts of Mn2-MnSOD and apo-MnSOD, 37°C, 15 h: a, Mn2-MnSOD, b, Mn1-MnSOD, and c Apo-MnSOD. (A) Metal uptake was initiated by addition of 1.25 equivalents of MnCl2 to apo-MnSOD as described in the Materials and Methods (Section 2.14). (1) MnSOD standards; (2) equal amounts of Mn2-MnSOD and apo-MnSOD mixed immediately before loading on the gel; (3–10) MnCl2 was added to apo-MnSOD and the metal uptake reaction was stopped at the indicated time points: 0, 1, 3, 5, 7, 10, 15, and 30 min, respectively. (B) Kinetic timecourses for metal uptake based on densitometric analysis of electrophoretic mobility shift data in (A). Normalized intensities for apo-MnSOD (●) and Mn2-MnSOD (■) were fitted to first order kinetic equations using nonlinear regression methods. Theoretical lines represent best-fit simulations with k1= 0.18 ± 0.01 min−1 (apo-MnSOD) and k1=0.2±0.02 min−1 (Mn2-MnSOD). (C) Metal uptake was initiated by addition of 0.4 equivalents of MnCl2 to apo-MnSOD as described in the Materials and Methods (Section 2.14). (1) MnSOD standards; (2) equal amounts of Mn2-MnSOD and Apo-MnSOD; (3–9) incubation time: 0, 1, 5, 10, 15, 30 min and 15 h, respectively.
Figure 4
Figure 4
Native PAGE analysis of subunit exchange between Mn2-MnSOD and Apo-MnSOD. MnSOD standards: a, Mn2-MnSOD, b, Mn1-MnSOD, and c Apo-MnSOD. (A) Time dependence of subunit exchange at 45°C. (1) MnSOD standards; (2) Mn2-MnSOD and Apo-MnSOD mixture, initial state (t = 0 min); (3–9) Mn2-MnSOD and Apo-MnSOD mixture incubated at 45°C for: 10 min, 0.5, 1, 1.5, 2, 2.5 3 h, respectively; (10 & 11) reaction in the presence of EDTA: (10) 37°C, 15 h; (11) 45°C, 3 h. (B) Kinetic timecourses for subunit exchange based on densitometric analysis of electrophoretic mobility shift data in (A). Normalized intensities for apo-MnSOD (■), Mn1-MnSOD (●) and Mn2-MnSOD (▲) were globally fit to three differential equations (d[P]/dt = d[PM2]/dt=−k1[P][PM2]+(0.5)k2[PM]2; d[PM2]/dt=(2)k1[P][PM2] −k2[PM2]2) using nonlinear regression methods. Theoretical lines representing best-fit simulations with k1= 1.4 h−1 and k2=1.5 h−1 are shown. (C) Temperature and pH dependence of subunit exchange. (1–4): incubated at 0°C, 37°C, 41°C, and 45°C (20 mM MOPS pH 7.8) for 1 h; (5–10): pH 5.5 (MES), 6.2 (MES), 7.0 (MOPS), 7.8 (MOPS), 8.2 (HEPES), and 8.8 (TAPS) at 45°C for 1 h. (D) Inhibition of subunit exchange by sodium chloride. (1) MnSOD standards; (2–9): 0, 20, 40, 60, 80, 120, 160, and 200 mM sodium chloride added to the reaction mixture (20 mM MOPS pH 7.8) and incubated at 45°C for 1 h.
Figure 5
Figure 5
Native PAGE analysis of subunit exchange during metal uptake by apo-MnSOD. (A) C-terminal Strep-tag II (C-Strep) MnSOD apo-protein. (1) wt apo-MnSOD; (2) C-Strep apo-MnSOD; (3) products of metal uptake reaction (37°C for 30 min) for a mixture of C-Strep and wt apo-MnSOD; (4) products of metal uptake reaction for wt apo-MnSOD; (5) products of metal uptake reaction for C-Strep apo-MnSOD; (6) mixture of Mn2-C-Strep MnSOD and Mn2-MnSOD incubated at 37°C for 0.5 h; (7) as (6) but incubated 15 h; (8) Mn2-C-Strep MnSOD and Mn2-MnSOD standards. The gel was run at 20 A/gel for 4 h at 0°C. (B) Alexa Fluor 594 and Alexa Fluor 647 labeled Q21C apo-MnSOD. (1) Alexa Fluor 594 apo-MnSOD (Q21C); (2) Alexa Fluor 647 apo-MnSOD (Q21C); (3) Alexa Fluor 594 Mn2-MnSOD (Q21C) after metal uptake reaction (37°C, 10 min); (4) Alexa Fluor 647 Mn2-MnSOD (Q21C) after metal uptake reaction (37°C, 10 min); (5) products of metal uptake reaction (37°C, 10 min) for equal mixture of Alexa Fluor 594 apo-MnSOD (Q21C) and Alexa Fluor 647 apo-MnSOD (Q21C); (6–8) an equal mixture of Alexa Fluor 594 Mn2-MnSOD (Q21C) (3) and Alexa Fluor 647 Mn2-MnSOD (Q21C) (4) incubated at: (6) 0°C, 3 h; (7) 37°C, 10 min; (8) 37°C, 1 h. The gel was run at 20 A/gel for 1.75 h at 0°C. (C) Fluorescence imaging of Alexa Fluor labeled MnSOD (Q21C) performed as described in the Materials and Methods (Section 2.12). (1) Alexa Fluor 594 Mn2-MnSOD (Q21C), (2) Alexa Fluor 647 Mn2-MnSOD (Q21C), (3) an equal mixture of Alexa Fluor 594 Mn2-MnSOD (Q21C) (1) and Alexa Fluor 647 Mn2-MnSOD (Q21C) (2) incubated at 37°C for 1 h. (a) Coomassie Blue stained native PAGE. (b) Native PAGE scanned with Typhoon TRIO+ fluorescence imager, 532 nm excitation, 647 nm emission. (c) 633 nm excitation, 670 nm emission. (d) 532 nm excitation, 670 nm emission. (e) Scan superposition showing FRET for the intermediate mobility species.
Figure 6
Figure 6
Metal uptake by disulfide-crosslinked apo-MnSOD (S126C). (A) Native PAGE electrophoretic mobility shift results for stoichiometric metal titration of apo-MnSOD (S126C)(SS). (1) apo-MnSOD (S126C)(SS); (2–8), products formed by addition of MnCl2 to apo-MnSOD (S126C)(SS): 0.3, 0.6, 0.8 1.2, 1.7, 2.3, 2.9 equivalents MnCl2 (20 mM MOPS pH 7.8) based on dimeric protein. (B) Quantitative analysis of species formed during stoichiometric titration of apo-MnSOD (S126C)(SS) by MnCl2. Normalized densitometric intensities for apo-MnSOD (S126C)(SS) (P) (■), Mn1-MnSOD (S126C)(SS) (PM) (●) and Mn2-MnSOD (S126C)(SS) (PM2) (▲) from (A) were globally fit to Equations 5–8 (Methods, section 2.17) using nonlinear regression methods. The solid lines are simulations based on the best-fit parameter values (K1=1.6×10⁷ M−1; K2=4.2×10¹² M−2; q1=1.5; q2=8). (C) Time-dependent metal uptake. (1) Mn2-, Mn1-, and apo-MnSOD (S126C)(SS) standards; (2–9) incubation of apo-MnSOD (S126C)(SS) with 1.4 equivalents of MnCl2 at 37°C for 0, 1, 3, 5, 7, 10, 15 or 30 min (20 mM MOPS pH 7.8). (D) Quantitative analysis of kinetic intermediates formed during reaction of apo-MnSOD (S126C)(SS) with MnCl2. Normalized densitometric intensities for apo-MnSOD (S126C)(SS) (P) (■), Mn1-MnSOD (S126C)(SS) (PM) (●) and Mn2-MnSOD (S126C)(SS) (PM2) (▲) from (C) were globally fit to three differential equations (d[P]/dt=−k1[P]; d[PM]/dt=k1[P] −k2[PM]; d[PM2]/dt=k2[PM]) using nonlinear regression methods. Theoretical lines representing best-fit simulations with k1= 2.2 min−1 and k2=0.1 min−1 are shown.
Figure 7
Figure 7
Protein concentration dependence of metal uptake kinetics. Metal uptake was monitored fluorimetrically (20 mM MOPS pH 7.6, 45°C) as described in the Material and Methods (Section 2.14). The ratio of fast phase amplitude to total amplitude (Fopen) was plotted against the total protein concentration (subunits) and the results analyzed in terms of equilibrium dissociation of the dimeric protein, as described in the Results (Section 3.3). (formula image
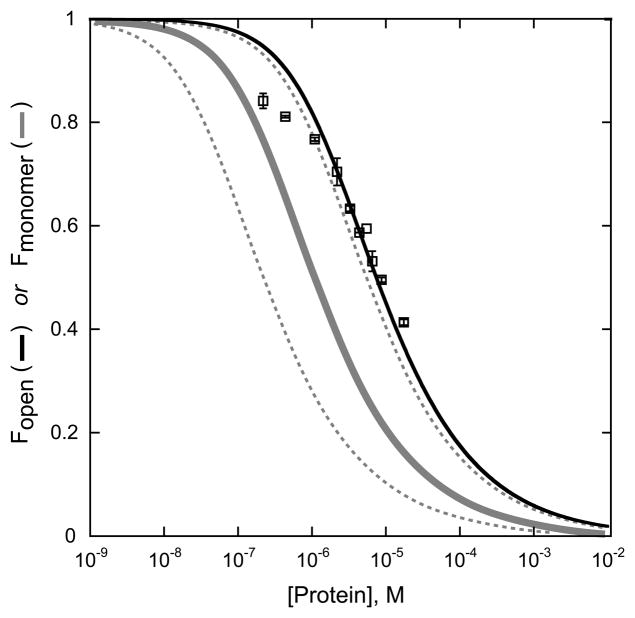
) theoretical curve for Fopen, KD = (6.6±0.9)×10−6 M. (formula image) theoretical curve for KD(SEC) = 1.1×10⁻⁶ M. (formula image)) bounding limits for 5-fold variation of KD(SEC).
Figure 8
Figure 8
Protein concentration dependence of size exclusion chromatography. Samples were loaded onto a 1.5×99 cm column of Sephacryl 100-HR equilibrated and run at 45°C in 20 mM MOPS pH 7.6 containing 1 mM EDTA. Elution profiles were monitored by absorption (O.D.280 nm) or fluorescenc e (λEX = 280 nm; λEM = 333 nm) and normalized for analysis. (○—○) Mn2-MnSOD, 1 mg; (□—□) Apo-MnSOD, 700 μg; (△—△) Apo-MnSOD, 350 μg; (◇—◇) Apo-MnSOD, 175 μg; (▽—▽) Apo-MnSOD, 87.5 μg; (■—■) Apo-MnSOD, 35 μg; (●—●) Fe2-MnSOD (E170A), 1 mg. (----) Theoretical elution profiles for all samples generated by SCIMMS simulation program using the following input parameters: diffusion coefficient (percent equilibration/cycle): monomer, 0.03; dimer, 0.015; dispersion coefficient (gaussian spread/translation): monomer, 0.142; dimer, 0.130. This analysis yields an estimate of the protein dimer dissociation constant KD(SEC) = 1.1×10⁻⁶ M.
Figure 9
Figure 9
In vivo metal uptake by apo-MnSOD. (A) Native PAGE electrophoretic mobility shift results for time-dependent Mn incorporation into apo-protein in E. coli after addition of MnCl2 to the induction medium. Reaction conditions as described in the Materials and Methods (Section 2.8). (1) top to bottom: Mn2-MnSOD, Fe2-MnSOD, Apo-MnSOD standards; (2) induction control with no chloramphenicol or MnCl2 added, cells collected after 4 hours induction; (3) cells collected immediately after addition of MnCl2 to 100 μM; (4–8) incubation at 35°C following addition of MnCl2; (4) 1 h; (5) 2 h; (6) 3 h; (7) 4 h; (8) 5 h; (9) 100 μM MnCl2 was added during induction and cells were collected after 4 h induction. (B) Quantitative analysis of in vivo metal uptake kinetics. Normalized densitometric intensities for apo-MnSOD (P) (■) and Mn2-MnSOD (PM2) (●) from (A) were globally fit to two differential equations (d[P]/dt=−k1[P]; d[PM2]/dt=k1[P]) using nonlinear regression methods. Theoretical lines representing best-fit simulations with k1= 0.6 h−1 are shown. (C) Temperature dependence of Mn uptake by apo-MnSOD following addition of Mn to the induction medium. (1) 25°C 1 h; (2) 25°C 3h; (3) 45°C 1 h; (4) 45°C 3 h. (D) Manganese concentration dependence of in vivo metal uptake by apo-MnSOD. (1) Mn2-MnSOD, Fe2-MnSOD, Apo-MnSOD standards; (2) 4 h induction with no MnCl2 added; (3) induction in presence of 100 μM MnCl2; (4–11) MnCl2 added 10 min after arresting de novo protein biosynthesis with chloramphenicol, and incubation continued at 35°C for 4 h: (4) 0 μM MnCl2; (5) 0.1 μM MnCl2; (6) 0.25 μM MnCl2; (7) 0.5 μM MnCl2; (8) 1 μM MnCl2; (9) 5 μM MnCl2; (10) 10 μM MnCl2; (11) 100 μM MnCl2.
Scheme 1
Scheme 1
Scheme 2
Scheme 2

Similar articles

Cited by

References

    1. McCord JM. Oxygen-derived free radicals. New Horiz. 1993;1:70–76. - PubMed
    1. Fridovich I. Superoxide radical and superoxide dismutases. Annu Rev Biochem. 1995;64:97–112. - PubMed
    1. Tainer JA, Getzoff ED, Beem KM, Richardson JS, Richardson DC. Determination and analysis of the 2 Å-structure of copper, zinc superoxide dismutase. J Mol Biol. 1982;160:181–217. - PubMed
    1. Lah MS, Dixon MM, Pattridge KA, Stallings WC, Fee JA, Ludwig ML. Structure-function in Escherichia coli iron superoxide dismutase: comparisons with the manganese enzyme from Thermus thermophilus. Biochemistry. 1995;34:1646–1660. - PubMed
    1. Edwards RA, Baker HM, Whittaker MM, Whittaker JW, Jameson GB, Baker EN. Crystal structure of Escherichia coli manganese superoxide dismutase at 2.1 Å resolution. J Biol Inorg Chem. 1998;3:161–171.

Publication types

LinkOut - more resources