. 2011 Apr 15;55(4):1804-15.
doi: 10.1016/j.neuroimage.2010.10.074. Epub 2010 Oct 31.

Changes in brain network activity during working memory tasks: a magnetoencephalography study

Affiliations

Changes in brain network activity during working memory tasks: a magnetoencephalography study

Matthew J Brookes et al. Neuroimage. .

Abstract

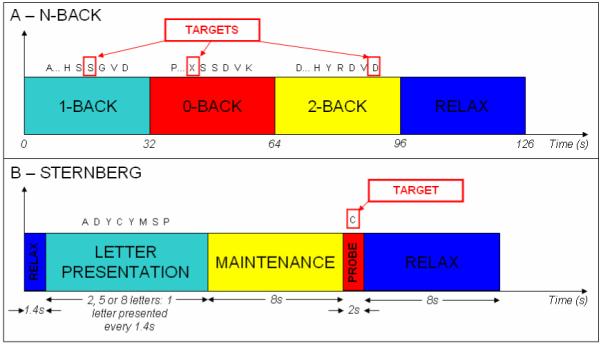
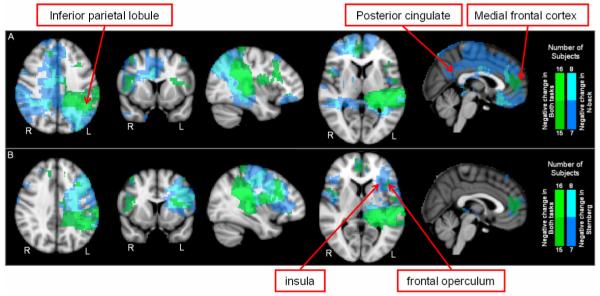
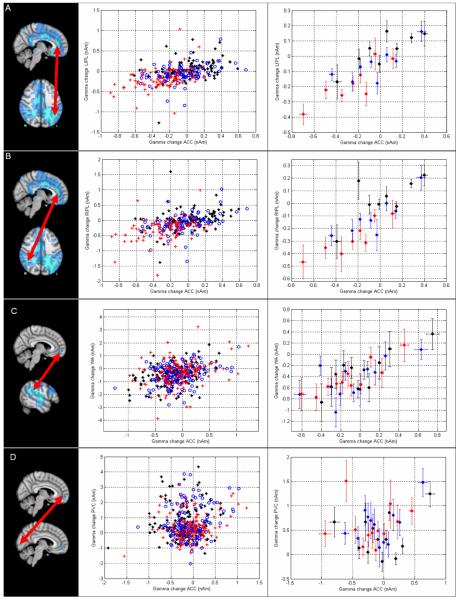
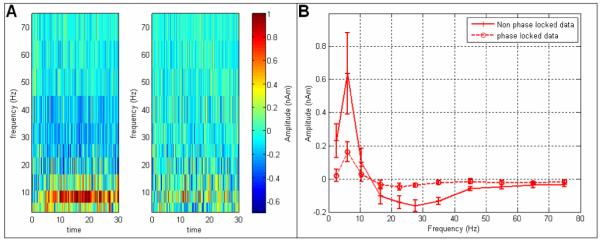
In this study, we elucidate the changes in neural oscillatory processes that are induced by simple working memory tasks. A group of eight subjects took part in modified versions of the N-back and Sternberg working memory paradigms. Magnetoencephalography (MEG) data were recorded, and subsequently processed using beamformer based source imaging methodology. Our study shows statistically significant increases in θ oscillations during both N-back and Sternberg tasks. These oscillations were shown to originate in the medial frontal cortex, and further to scale with memory load. We have also shown that increases in θ oscillations are accompanied by decreases in β and γ band oscillations at the same spatial coordinate. These decreases were most prominent in the 20-40 Hz frequency range, although spectral analysis showed that γ band power decrease extends up to at least 80 Hz. β/γ Power decrease also scales with memory load. Whilst θ increases were predominately observed in the medial frontal cortex, β/γ decreases were associated with other brain areas, including nodes of the default mode network (for the N-back task) and areas associated with language processing (for the Sternberg task). These observations are in agreement with intracranial EEG and fMRI studies. Finally, we have shown an intimate relationship between changes in β/γ band oscillatory power at spatially separate network nodes, implying that activity in these nodes is not reflective of uni-modal task driven changes in spatially separate brain regions, but rather represents correlated network activity. The utility of MEG as a non-invasive means to measure neural oscillatory modulation has been demonstrated and future studies employing this technology have the potential to gain a better understanding of neural oscillatory processes, their relationship to functional and effective connectivity, and their correspondence to BOLD fMRI.


Figures

Figure 1
Figure 1
Schematic diagrams of A) The N-Back and B) the Sternberg tasks.
Figure 2
Figure 2
Spatial distribution of task induced changes in θ. A) Single subject N-back; B) Single subject Sternberg; C) Group N-back; D) Group Sternberg.
Figure 3
Figure 3
Change in oscillatory power in the medial frontal lobe with respect to the resting phase: A and B show difference spectra for N-back and Sternberg respectively. C and D show the mean difference in spectral amplitude between maintenance and relax periods in the θ band plotted against the same measurement in the β/γ (20Hz – 40Hz) band. C and D show N-back and Sternberg results respectively. E shows TF difference spectra for the 3 N-back phases. F shows a TF spectrum for the 8-letter Sternberg task with the θ and high-β/low-γ Hilbert envelopes inset.
Figure 4
Figure 4
The relationship between the amplitude of θ and β/γ changes in the medial frontal cortex. A) N-back task. The red points show 2-back trials, the blue points show 1-back trials and the black points show 0-back trials. B) Sternberg task. The red points show 8 letter maintenance, the blue points show 5 letter maintenance and the black points show 2 letter maintenance. In both tasks the upper panels show the result for all trials; the lower panels show trials grouped into sets of 12 (according to θ power change) and averaged.
Figure 5
Figure 5
Distribution of significant task induced changes in β and γ power. A) N-back; B) Sternberg. Green overlay shows areas common to both tasks. Note that the effects shown are all power decreases in the β/γ band. Whilst some positive effects were observed, they were not consistent on all subjects.
Figure 6
Figure 6
Results of trial by trial coupling analysis between network nodes in the β/γ range. A) β/γ change in medial frontal cortex plotted against β/γ change in the left inferior parietal lobule for the N-back task. Significant linear modulation was observed both across phases of the task (r2 = 0.22; p = 3×10⁻¹⁷) and within single phases (e.g. 2 back; r2 = 0.18; p = 1.6×10⁻⁵). B) β/γ change in medial frontal cortex plotted against β/γ change in the right inferior parietal lobule, again for the N-back task. Significant linear modulation was observed (r2 = 0.1; p = 2×10⁻⁸ - all phases, r2 = 0.14; p = 0.0002 - 2-back). C) β/γ change in medial frontal cortex plotted against β/γ change in left lateralised language area for the Sternberg task ( r2 = 0.1; p = 3×10⁻¹² - all conditions, r2 = 0.16; p = 9×10⁻⁷ - 8-letter maintenance) D) β/γ change in medial frontal cortex plotted against β/γ change in primary visual cortex for the Sternberg task. Here, no significant modulation was observed ( r2 = 0.015; p = 0.01 - all conditions, r2 = 0.004; p = 0.44 - 8-letter maintenance). In all cases the left hand column shows the brain areas involved; the centre column shows the result for all trials; the right hand column shows trials grouped into sets of 12 (according to power change at the ACC) and averaged. All statistics are based on unaveraged data.
Figure A1
Figure A1
Phase locked vs non-phase locked θ power. A) Time-frequency difference spectra for the two-back phase of the task. In the left hand panel, timecourses are Hilbert transformed prior to averaging across trials. In the right hand panel, timecourses are averaged across trials prior Hilbert transformation. B) Difference spectra, averaged across time for the two-back phase of the task.

References

    1. Axmacher N, Henseler MM, Jensen O, Weinreich I, Elger CE, Fell J. Cross-frequency coupling supports multi-item working memory in the human hippocampus. Proceedings of the National Academy of Science USA. 2010;107:3228–3233. - PMC - PubMed
    1. Basar E, Basar-Eroglu C, Karakas S, Schurmann M. Gamma, alpha, delta, and theta oscillations govern cognitive processes. International Journal of Psychophysiology. 2001;39:241–248. - PubMed
    1. Blackledge JM. Digital signal processing. Horwood Publishing; Chichester: 2003.
    1. Brookes MJ, Vrba J, Robinson SE, Stevenson CM, Peters AP, Barnes GR, Hillebrand A, Morris PG. Optimising experimental design for MEG beamformer imaging. NeuroImage. 2008;39:1788–1802. - PubMed
    1. Brookes MJ, Gibson AM, Hall SD, Furlong PL, Barnes GR, Hillebrand A, Singh KD, Holliday IE, Francis ST, Morris PG. GLM-beamformer method demonstrates stationary field, alpha ERD and gamma ERS co-localisation with fMRI BOLD response in visual cortex. Neuroimage. 2005;26:302–308. - PubMed

Publication types

LinkOut - more resources