. 2011 Jan 7;286(1):469-79.
doi: 10.1074/jbc.M110.164384. Epub 2010 Nov 2.

SLUG-induced elevation of D1 cyclin in breast cancer cells through the inhibition of its ubiquitination

Affiliations

SLUG-induced elevation of D1 cyclin in breast cancer cells through the inhibition of its ubiquitination

Mukul K Mittal et al. J Biol Chem. .

Abstract

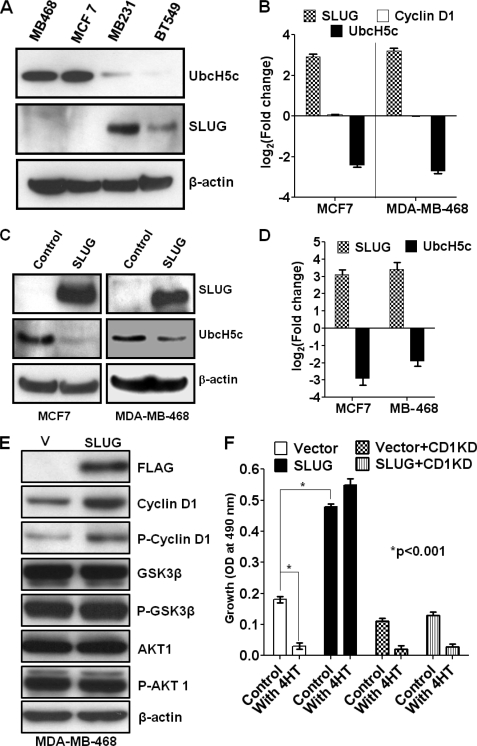
UbcH5c, a member of the UbcH5 family of protein ubiquitin conjugase E2 enzymes, is a critical component of biological processes in human cells, being the initial ubiquitinating enzyme of substrates like IκB, TP53, and cyclin D1. We report here that the metastasis regulator protein SLUG inhibits the expression of UbcH5c directly through chromatin remodeling and thus, among other downstream effects, elevates the level of cyclin D1, thus enhancing the growth rates of breast cancer cells. Overexpression of SLUG in the SLUG-deficient breast cancer cells significantly decreased the levels of mRNA and protein of UbcH5c but only elevated the protein levels of cyclin D1. On the contrary, knockdown of SLUG in SLUG-high breast cancer cells elevated the levels of UbcH5c while decreasing the level of cyclin D1 protein. SLUG is recruited at the E2-box sequence at the UbcH5c gene promoter along with the corepressor CtBP1 and the effector HDAC1 to silence the expression of this gene. Knockdown of UbcH5c in the SLUG-deficient human breast cells elevated the level of cyclin D1 as well as the rates of proliferation and invasiveness of these cells. Whereas the growth rates of the cells are enhanced due to overexpression of SLUG or knockdown of UbcH5c in the breast cancer cells tested, ER(+) cells also acquire resistance to the anti-estrogen 4-hydroxytamoxifen due to the rise of cyclin D1 levels in these cells. This study thus implicates high levels of SLUG and low levels of UbcH5c as a determinant in the progression of metastatic breast cancer.


Figures

FIGURE 1.
FIGURE 1.
Correlation between SLUG and cyclin D1 levels in breast tissues and cells. A, human breast cancer tissue microarray was examined for cyclin D1 and SLUG expressions by immunohistochemistry using mouse anti-cyclin D1 and rabbit anti-SLUG antibodies. A low magnification (×4) immunofluorescence micrograph of the array is shown in the supplemental material (supplemental Fig. 1S). We show here a higher magnification (×30) immunofluorescence micrograph for selected spots. The coordinates of the spots are marked as detailed in supplemental Table 3S. B, evaluation of the levels of cyclin D1 in normal and SLUG-expressing human breast cancer cells by immunofluorescence microscopy. 468C and MCF7C, MDA-MB-468 and MCF7 cells transfected with empty vector; 468SLUG and MCF7SLUG, cells expressing C-terminal FLAG-tagged SLUG; 231C and BT549C, normal MDA-MB-231 and BT549 cells.
FIGURE 2.
FIGURE 2.
Effect of SLUG overexpression on the levels of cyclin D1 in MDA-MB-468 cells. A, increase in cyclin D1 levels in SLUG-expressing MDA-MB-468 cells. A Western blot shows higher levels of cyclin D1 in the recombinant cells. B, densitometric scan for cyclin D1 and SLUG levels in six independent SLUG-transfected populations and vector controls. Results are mean ± S.E. (error bars) (n = 6). The -fold changes were statistically significant (p < 0.001). C, evaluation of SLUG, cyclin D1, and UbcH5c protein levels in four different breast cancer cell lines by Western blotting. Bands were developed using IR dye-conjugated secondary antibody (LI-COR Biosciences) and visualized using the LI-COR Odyssey infrared imaging system. Quantitation and analysis of bands were performed using Odyssey software. β-Actin was used as normalization control. Levels of SLUG and cyclin D1 in the MDA-MB-231 cells and that of UbcH5c in the MCF7 cells were taken as 100 for comparison. Results are mean ± S.E. (n = 4).
FIGURE 3.
FIGURE 3.
Effect of SLUG expression on UbcH5c and cyclin D1 levels in MDA-MB-468 and MCF7 cells. A, a typical immunoblot showing UbcH5c and SLUG protein levels in different human breast cancer cells. MB468, MDA-MB-468 cells; MB231, MDA-MB-231 cells. B, real-time RT-PCR analysis of the levels of SLUG, UbcH5c, and cyclin D1 mRNAs in SLUG-overexpressing MCF7 and MDA-MB-468 cells. Results are mean ± S.E. (n = 6). The differences between the experimental and control sets were statistically significant (p < 0.001). C, immunoblot analysis for SLUG and UbcH5c proteins in the control and SLUG-overexpressing (SLUG) MCF7 and MDA-MB-468 cells. D, densitometric scan for SLUG and UbcH5c levels in six independent SLUG-transfected populations and corresponding vector-transfected control cells. Results are mean ± S.E. (n = 6). The -fold changes were statistically significant (p < 0.001). E, immunoblot analysis data showing the effects of SLUG overexpression on the levels of cyclin D1, phosphocyclin D1 (at Thr286), GSK3β, phospho-GSK3β, AKT, and phospho-AKT in MDA-MB-468 cells. Control cells (V) were transfected with empty vector DNA instead of SLUG construct plasmid DNA. Recombinant SLUG was FLAG-tagged at the C-terminal end and thus was detected with anti-FLAG antibody. β-Actin was used as a loading control. F, effect of cyclin D1 knockdown (CD1KD) on the SLUG-induced increase in cell proliferation and tamoxifen (4HT; 10 μm) resistance in MCF7 cells. Control cells were transfected with empty vector DNA instead of SLUG construct plasmid DNA. Results are mean ± S.E. (n = 6). Data with cyclin D1 siRNA stealth-311 (supplemental Table 2S) are shown. Other siRNA, stealth-568, also yielded similar results (data not shown). The ability of stealth-311 to knock down cyclin D1 in MDA-MB-231 cells is shown in supplemental Fig. 3S.
FIGURE 4.
FIGURE 4.
Effect of knockdown of SLUG on cyclin D1 levels in MDA-MB-231 and BT549 cells. A, quantitative RT-PCR analysis for SLUG, UbcH5c, and cyclin D1 mRNA levels in MDA-MB-231 cells treated with different siRNAs (supplemental Table 2S). B, immunoblot analysis of UbcH5c and cyclin D1 levels in MDA-MB-231 and BT549 cells with (SLUGKD) or without (Control) knocking down SLUG (siRNA#1, stealth-21). Control cells were transfected with control siRNA. C, evaluation of SLUG, cyclin D1, and UbcH5c protein levels in MDA-MB-231 and BT549 cells with or without knockdown of SLUG. Six independent SLUG-knocked down cell populations and corresponding control siRNA-treated cells were used. Data with siRNA#1 as the reagent for the knockdown are shown. Similar results were obtained with stealth-223 (siRNA#2; data not shown). Bands were developed using IR dye-conjugated secondary antibody (LI-COR Biosciences) and visualized using the LI-COR Odyssey infrared imaging system. Quantitation and analysis of bands were performed using Odyssey software. β-Actin was used as normalization control. Results are mean ± S.E. (error bars) (n = 6). -Fold changes observed were statistically significant (p < 0.001). D, effect of knockdown of SLUG in MDA-MB-231 cells on their rate of proliferation and the role of non-degradable cyclin D1 mutant (T286A) in this process. Cells were transiently transfected with wild type or HA-tagged T286A mutant of cyclin D1 along with the siRNA (control or anti-SLUG). Results are mean ± S.E. (n = 6). The effect of SLUG knockdown with wild-type cyclin D1 was statistically significant (p < 0.0001). E, effect of the proteasome inhibitor MG132 on the decrease in cyclin D1 in SLUG-knocked down MDA-MB-231 cells. Control cells were transfected with empty vector DNA. β-Actin was used as loading control. Veh, vehicle (DMSO) for MG132 solution. F, densitometric analysis of immunoblot data as in E from three independent experiments. The upper panel (i) shows the effect on SLUG level, and the lower panel (ii) shows the effect on cyclin D1 levels. Experimental data are normalized assuming respective control as 100. Results are mean ± S.E. (n = 3); *, statistical significance in comparison with respective control (p < 0.001).
FIGURE 5.
FIGURE 5.
Effect of knockdown of UbcH5c on cyclin D1 levels in MDA-MB-468 and MCF7 cells. A, immunoblot analysis showing the effect of knockdown of UbcH5c (H5cKD) on cyclin D1 level in MDA-MB-468 cells. Control cells were transfected with control siRNA. B, immunoblot analysis showing the effect of knockdown of UbcH5c on cyclin D1 level in MCF7 cells. β-Actin was used as loading control. Control cells were transfected with control siRNA. C, evaluation of cyclin D1 and UbcH5c protein levels in MDA-MB-468 cells with or without knockdown of UbcH5c. Six independent UbcH5c-knocked down cell populations and corresponding control siRNA-treated cells were used. D, evaluation of cyclin D1 and UbcH5c protein levels in MCF7 cells with or without knockdown of UbcH5c. Six independent UbcH5c-knocked down cell populations and corresponding control siRNA-treated cells were used. For the experiments in C and D, bands were developed using IR dye-conjugated secondary antibody (LI-COR Biosciences) and visualized using the LI-COR Odyssey infrared imaging system. Quantitation and analysis of bands were performed using Odyssey software. β-Actin was used as normalization control. Results are mean ± S.E. (error bars) (n = 6). Fold changes observed were statistically significant (p < 0.001). E, proliferation assays with the control and UbcH5c knockdown MCF7 cells in the absence or presence of 4HT (10 μm) and the effects of simultaneous knockdown of cyclin D1 (CD1+H5cKD) in these processes. Results are mean ± S.E. (n = 6). Data with cyclin D1 siRNA stealth-311 (supplemental Table 2S) are shown. Other siRNA, stealth-568, also yielded similar results (data not shown). F, Matrigel invasion assay with UbcH5c knocked down MCF7 and MDA-MB-468 cells. Results are mean ± S.E. (n = 6). Data with siRNA stealth-1106 (supplemental Table 2S) are shown. Other siRNA, stealth-1214, also yielded similar results (data not shown).
FIGURE 6.
FIGURE 6.
Effect of overexpression of UbcH5c on cyclin D1 levels and proliferation in SLUG-high MDA-MB-231 cells. A, immunoblot analysis showing the effect of overexpression of UbcH5c on cyclin D1 level. Control cells were transfected with empty vector DNA. UbcH5c levels were assessed by using Myc antibody for the recombinant protein and UbcH5c antibody for the total of the endogenous and recombinant protein. B, proliferation assays with the control and UbcH5c-overexpressed (UbcH5cOE) MDA-MB-231 cells. Results are mean ± S.E. (error bars) (n = 6).
FIGURE 7.
FIGURE 7.
Inhibition of the UbcH5c promoter activity in SLUG-expressing human breast cells. A, ChIP analysis for the binding of SLUG to the promoter of the UbcH5c gene in FLAG-tagged SLUG-expressing (+SLUG) MCF7 and MDA-MB-468 cells. Immunoprecipitation (IP) was done with FLAG antibody to immunoprecipitate chromatin fragments bound to FLAG-tagged SLUG. B, ChIP analysis for the binding of SLUG to the promoter of the UbcH5c gene in the control and the SLUG-knocked down MDA-MB-231 and BT549 (−SLUGKD) cells. ChIP grade SLUG antibody was used for immunoprecipitation of wild-type SLUG-bound chromatin fragments. C, repression of the UbcH5c promoter in the SLUG-expressing (SLUGOVEX) MCF7 and MDA-MB-468 cells. D, effect of E2-box mutation at the UbcH5c promoter on its activity in SLUG-expressing MCF7 cells. In C and D, the averages from six different SLUG-transfected populations and controls are shown. Results are mean ± S.E. (error bars) (n = 6). Decreases in the luciferase activities were statistically significant (p < 0.001).
FIGURE 8.
FIGURE 8.
Mechanism of repression of UbcH5c promoter by SLUG in breast cancer cells. A, ChIP analysis for the co-recruitments of CtBP1 and HDAC1 with SLUG at the UbcH5c promoter. B, immunoblot analysis for the effect of trichostatin A (TSA) on SLUG-induced repression of UbcH5c levels in SLUG-expressing MDA-MB-468 cells. C, ChIP analysis showing the decrease of acetylated histones H3 and H4 at the UbcH5c promoter in SLUG-expressing MDA-MB-468 cells. D, quantitative ChIP analysis to evaluate the levels of acetylated histones H3 and H4 at the UbcH5c promoter in SLUG-expressing MDA-MB-468 cells. *, statistical significance (p < 0.001). E, model for the regulation of UbcH5c promoter by SLUG in human breast cancer cells by chromatin remodeling. BD, DNA binding domain of SLUG; RD, repressor domain for SLUG. Error bars, S.E.

Similar articles

Cited by

References

    1. López-Otín C., Hunter T. (2010) Nat. Rev. Cancer 10, 278–292 - PubMed
    1. Gallastegui N., Groll M. (2010) Trends Biochem. Sci. 35, 634–642 - PubMed
    1. Fang Y., Fu D., Shen X. Z. (2010) Biochim. Biophys. Acta 1806, 1–6 - PubMed
    1. Pickart C. M. (2001) Annu. Rev. Biochem. 70, 503–533 - PubMed
    1. Baek K. H. (2006) Curr. Protein Pept. Sci. 7, 171–177 - PubMed

Publication types

MeSH terms