. 2011 Jan;39(Database issue):D1141-8.
doi: 10.1093/nar/gkq1085. Epub 2010 Nov 2.

RiceXPro: a platform for monitoring gene expression in japonica rice grown under natural field conditions

Affiliations

RiceXPro: a platform for monitoring gene expression in japonica rice grown under natural field conditions

Yutaka Sato et al. Nucleic Acids Res. 2011 Jan.

Abstract

Elucidating the function of all predicted genes in rice remains as the ultimate goal in cereal genomics in order to ensure the development of improved varieties that will sustain an expanding world population. We constructed a gene expression database (RiceXPro, URL: http://ricexpro.dna.affrc.go.jp/) to provide an overview of the transcriptional changes throughout the growth of the rice plant in the field. RiceXPro contains two data sets corresponding to spatiotemporal gene expression profiles of various organs and tissues, and continuous gene expression profiles of leaf from transplanting to harvesting. A user-friendly web interface enables the extraction of specific gene expression profiles by keyword and chromosome search, and basic data analysis, thereby providing useful information as to the organ/tissue and developmental stage specificity of expression of a particular gene. Analysis tools such as t-test, calculation of fold change and degree of correlation facilitate the comparison of expression profiles between two random samples and the prediction of function of uncharacterized genes. As a repository of expression data encompassing growth in the field, this database can provide baseline information of genes that underlie various agronomically important traits in rice.


Figures

Figure 1.
Figure 1.
Overview of data source used in database construction. RiceXPro currently contains data sets corresponding to spatiotemporal profiling based on 48 different tissues and organs at various developmental stages, and continuous profiling of leaves from transplanting until harvesting. The database was designed to provide baseline information on gene expression of rice grown under natural field conditions.
Figure 2.
Figure 2.
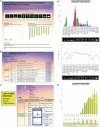
Retrieval of gene expression profile in RiceXPro. (A) A snap shot of the web-interface for RXP_0001 data set. Data search can be initiated by entering one or more keywords such as RAP-DB locus ID, MSU Osa1 Rice Loci, accession number or gene name, or by selecting a particular chromosome to get the expression data of all genes based on the position in the chromosome. Correlation and t-test/FC analysis allow the user to perform basic data analysis. (B) Tabular list of genes generated from keyword search with ‘MADS’. (C) Links and other information that can be obtained from the tabular list of searched data. The locus ID column provides a pull-down menu for direct links to other databases and results of correlation analysis within a dataset. The expression profile is obtained via the ‘FeatureNum’ column, and putting the mouse on a feature number opens a pop-up window of the profile for each gene. The ‘Select all’ or the ‘Locus Select’ or ‘Feature Select’ buttons are used to specify genes for downloading the graph, heatmap construction and sequence retrieval options. In order to retrieve the sequence of selected genes, user must check ‘mRNA’, ‘genome’, ‘protein’, ‘upstream 1 k’ or ‘upstream 2k’ button. Each probe is assigned with a sequence ID based on the alignment of the sequence and provides a link to the sequence information. (D) Graphical representation of expression profile for each gene. The bar graph and the line graph represent raw signal intensity and normalized signal intensity for ‘Os03g0752800’, respectively, derived from spatiotemporal profiling of various tissues and organs (RXP_0001). (E) The bar graph representing raw signal intensity for ‘Os03g0752800’ derived from continuous profiling of leaves (RXP_0003).
Figure 3.
Figure 3.
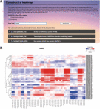
Download option for heatmap of expression data. (A) Web interface for construction of heatmap. Users can select ‘Customized ordering’ or ‘Clustering’ option to construct a heatmap. (B) The heatmap of 97 probes corresponding to 39 `MADS’ loci generated with the clustering method.
Figure 4.
Figure 4.
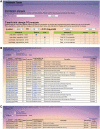
Analysis tools provided by RiceXPro database. (A) Interface for correlation analysis and t-test/FC analysis. (B) Tabular list of genes generated by correlation analysis for ‘Os04g0179700’. (C) Tabular list of genes generated by t-test and FC analysis with P-value (<0.01) and FC (>10) setting between a control (leaf blade_vegetative_12:00) and a test sample (leaf blade_vegetative_00:00).

Similar articles

Cited by

References

    1. International Rice Genome Sequencing Project. The map-based sequence of the rice genome. Nature. 2005;436:793–800. - PubMed
    1. Ohyanagi H, Tanaka T, Sakai H, Shigemoto Y, Yamaguchi K, Habara T, Fujii Y, Antonio BA, Nagamura Y, Imanishi T, et al. The Rice Annotation Project Database (RAP-DB): hub for Oryza sativa ssp. japonica genome information. Nucleic Acids Res. 2006;34:D741–D744. - PMC - PubMed
    1. Rice Annotation Project. Curated genome annotation of Oryza sativa ssp. japonica and comparative genome analysis with Arabidopsis thaliana. Genome Res. 2007;17:175–183. - PMC - PubMed
    1. Rice Annotation Project. The rice annotation project database (RAP-DB): 2008 update. Nucleic Acids Res. 2008;36:D1028–D1033. - PMC - PubMed
    1. Jung KH, An G, Ronald PC. Towards a better bowl of rice: assigning function to tens of thousands of rice genes. Nat. Rev. Genet. 2008;9:91–101. - PubMed

Publication types