. 2010 Nov 2:6:425.
doi: 10.1038/msb.2010.74.

An atlas of gene regulatory networks reveals multiple three-gene mechanisms for interpreting morphogen gradients

Affiliations

An atlas of gene regulatory networks reveals multiple three-gene mechanisms for interpreting morphogen gradients

James Cotterell et al. Mol Syst Biol. .

Abstract

The interpretation of morphogen gradients is a pivotal concept in developmental biology, and several mechanisms have been proposed to explain how gene regulatory networks (GRNs) achieve concentration-dependent responses. However, the number of different mechanisms that may exist for cells to interpret morphogens, and the importance of design features such as feedback or local cell-cell communication, is unclear. A complete understanding of such systems will require going beyond a case-by-case analysis of real morphogen interpretation mechanisms and mapping out a complete GRN 'design space.' Here, we generate a first atlas of design space for GRNs capable of patterning a homogeneous field of cells into discrete gene expression domains by interpreting a fixed morphogen gradient. We uncover multiple very distinct mechanisms distributed discretely across the atlas, thereby expanding the repertoire of morphogen interpretation network motifs. Analyzing this diverse collection of mechanisms also allows us to predict that local cell-cell communication will rarely be responsible for the basic dose-dependent response of morphogen interpretation networks.


Conflict of interest statement

The authors declare that they have no conflict of interest.

Figures

Figure 1
Figure 1
Combining topology space with a realistic model of gene regulation. (A) Our model of development is derived from a realistic model of Drosophila anterior–posterior patterning (Mjolsness et al, 1991; Reinitz and Sharp, 1995; Jaeger et al, 2004). This spatial model consists of a one-dimensional row of cells with the GRN repeated in each cell. Cells can signal to one another by means of diffusible gene products (dashed arrows). Specifically, we look for GRNs that have the ability to generate an output with a single stripe of gene expression (green line) by interpreting a morphogen input signal in the form of a gradient (black line). An example of a single stripe of gene expression for the Krüppel gene is shown, the data for which was taken from the FlyEx database (Poustelnikova et al, 2004; Pisarev et al, 2009). (B) A GRN topology where two of the gene–gene interactions α and β correspond to the parameter space in (C). (C) A parameter space of the two parameters α and β. Dots are random parameter sets from this space. (D) A topology space is created if all values of α and β that are positive are considered gene–gene activations, those values of α and β that are negative are considered gene–gene repressions and those values of α and β that are 0 are considered to generate no gene–gene interaction. Regions of parameter space corresponding to the different topologies are indicated by the different colored circles surrounding the topologies and the different colored dots in (E). Where topologies differ by a single gene–gene interaction (one Hamming distance) they are linked by a blue line. Such links connect regions of close parameter space.
Figure 2
Figure 2
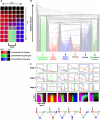
Creating a complexity atlas reveals the core topologies for single-stripe patterning. Nodes are GRN topologies, and edges link those with a single-topological change. The GRN topologies are laid out such that topological complexity increases up the y axis (see left-hand key). Spacing along the x axis is organized to reduce edge crossing. This reveals a striking structure to the network, in which ‘stalactites’ are seen protruding from the bottom of the atlas. These stalactites converge downwards to individual ‘core’ topologies (which are illustrated below the atlas). Mutational robustness, as measured by the fraction of functional parameter space, is shown by the shading (darker topologies are more robust). The six-core topologies chosen for further investigation are shown beneath along with their corresponding color-coded label (A–F). The morphogen input is denoted by ‘M.’ Genes in each core topology have the following color code: green is the stripe gene, red is the gene receiving the morphogen input (if it is not also the stripe gene) and blue is the default remaining gene. If the gene receiving the morphogen input is also the stripe gene, it is green and the remaining two genes are randomly assigned a red or blue color.
Figure 3
Figure 3
The six mechanisms are distinct and (A) How to construct a space–time plot. The concentration of the three genes in each cell (x axis) at each time point (y axis) is indicated by the intensity of the red, green or blue, respectively. (B) A hierarchical clustering of 300 solution space–time plots, 50 of which were randomly generated for each core topology. This tree shows that the six mechanisms are distinct as the space–time plots naturally cluster into six separate categories. Branches of the six main groups are colored according to the core topology from which the solution derives. (C) Gene expression graphs of each mechanism at different stages are shown below the tree along with a single space–time plot that captures these stages in a single image. A narrative description of each of the mechanisms can be found in Box 1. The core topologies for each of the mechanisms are also shown beneath the space–time plots.
Figure 4
Figure 4
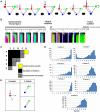
Interpolating between parameter sets reveals the mechanisms to be discrete. (A) Illustration of the method of interpolating directly through parameter space using functional parameter sets from core topologies. Gene–gene interactions that are present in one-core topology and not the other are reduced to 0 as the interpolation moves away from that topology. (B) Showing two interpolations through continuous parameter space from A-to-B and B-to-C (whose positions on the complexity atlas are indicated). The horizontal black line represents the linear interpolation between the parameter combinations. They gray bar above illustrates where an interpolation was functional. Example of space–time plots from various points of the interpolation are shown beneath. (Left) In the first example (A-to-B), some interpolations are possible without losing the stripe-forming functionality, as illustrated by the continuous gray bar and space–time plots with a stripe at each stage of the interpolation. (Right) By contrast, the interpolation from B-to-C passes through a large non-functional region of parameter space (broken gray bar). (C) A triangular matrix describing whether it is possible to interpolate between the core topologies for each mechanism. Where there is a topological contradiction (one-core topology requires a repression, whereas the other requires an activation) squares are colored black, and an interpolation was never tested. For each case where an interpolation was possible, we attempted 625 interpolations between randomly selected parameter sets, the results of which are shown in (D). If a single interpolation was successful, squares are colored yellow. When every interpolation was not successful, the square was colored gray. (D) Histograms of 625 attempted interpolations between functional parameter sets from non-topologically contradictory core topologies. For each interpolation, 20 direct equidistant steps were taken. The gap size is the number of non-functional steps within that interpolation. Only the transition A-to-B is possible as indicated by gap sizes of 0. (E) The modular nature of mechanisms A and B. The two mechanisms share an X module and only differ depending on which Y module they utilize.
Figure 5
Figure 5
Mapping the six mechanisms to the complexity atlas provides the first explicit map of mechanisms for morphogen interpretation. (A) The topologies of the complexity atlas are colored according to the mechanism by which they produce the single stripe of gene expression (as shown in Figures 2 and 3). Topologies that are capable of performing multiple mechanisms are shown in yellow. Mechanisms occupy locally connected regions of the complexity atlas, and together cover 78% of the topologies. (B) The known biological systems that each morphogen interpretation mechanism is associated with are illustrated by the core topologies and the images beneath. Morphogen interpretation mechanisms from diverse contexts including Drosophila and Xenopus can be seen. Two of the mechanisms (B and F) are involved in Drosophila axial patterning. The gap gene subnetworks that correspond to our mechanisms are shown in the bounded region along with the real quantified gene expression patterns for the corresponding genes (from the FlyEx database; Poustelnikova et al, 2004; Pisarev et al, 2009). The core topology of A is found within the GRN that controls the mesoderm inducer Xenopus Brachyury (XBra) expression (Green, 2002). Schematic versions of the gene expression pattern of the three genes in the XBra control network are shown beneath. Those mechanisms labeled with a ‘?’ are those that have not been observed in real biological contexts. These can be added to our repertoire of morphogen interpreting mechanisms.

Similar articles

Cited by

References

    1. Bayly RD, Ngo M, Aglyamova GV, Agarwala S (2007) Regulation of ventral midbrain patterning by Hedgehog signaling. Development 134: 2115–2124 - PubMed
    1. Briscoe J, Chen Y, Jessell TM, Struhl G (2001) A hedgehog-insensitive form of patched provides evidence for direct long-range morphogen activity of sonic hedgehog in the neural tube. Mol Cell 7: 1279–1291 - PubMed
    1. Chouard T (2008) Beneath the surface. Nature 456: 300–303 - PubMed
    1. Ciliberti S, Martin OC, Wagner A (2007) Robustness can evolve gradually in complex regulatory gene networks with varying topology. PLoS Comput Biol 3: 164–173 - PMC - PubMed
    1. Clyde DE, Corado MS, Wu X, Paré A, Papatsenko D, Small S (2003) A self-organizing system of repressor gradients establishes segmental complexity in Drosophila. Nature 18: 849–853 - PubMed

Publication types