. 2010 Nov 2:6:426.
doi: 10.1038/msb.2010.79.

Intra- and inter-chromosomal interactions correlate with CTCF binding genome wide

Affiliations

Intra- and inter-chromosomal interactions correlate with CTCF binding genome wide

Marco Botta et al. Mol Syst Biol. .

Abstract

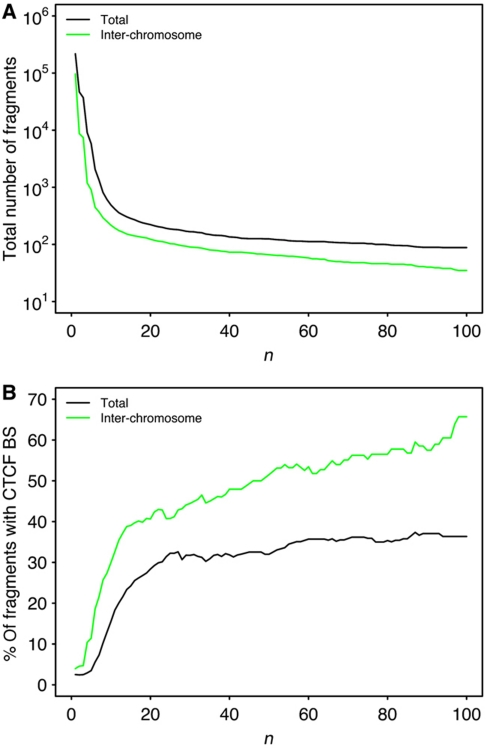
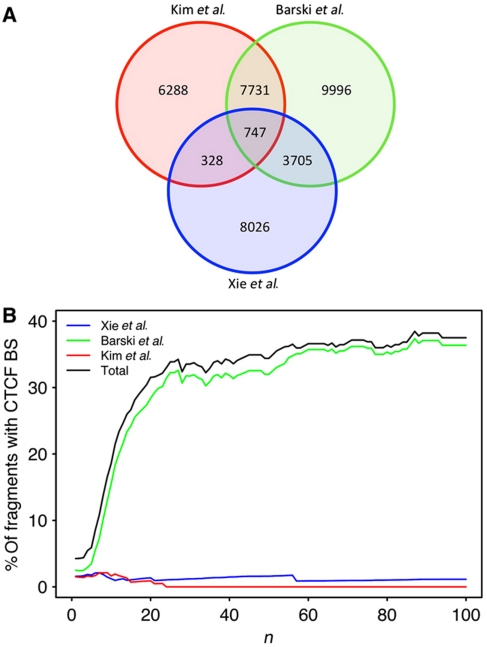
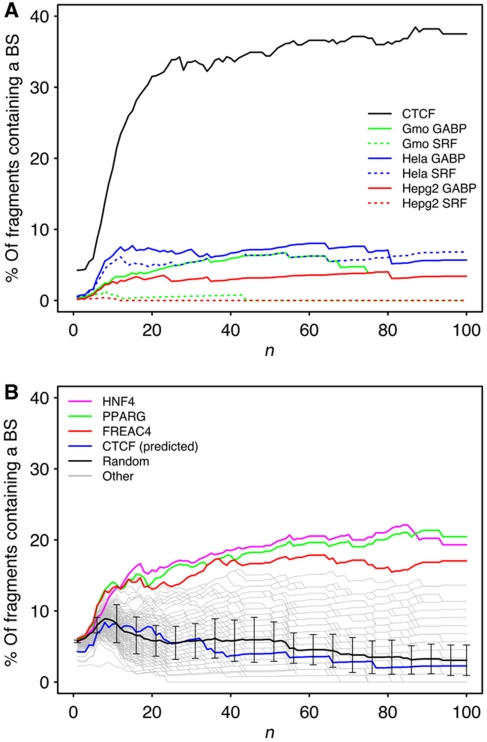
A prime goal in systems biology is the comprehensive use of existing high-throughput genomic datasets to gain a better understanding of chromatin organization and genome function. In this report, we use chromatin immunoprecipitation (ChIP) data that map protein-binding sites on the genome, and Hi-C data that map interactions between DNA fragments in the genome in an integrative approach. We first reanalyzed the contact map of the human genome as determined with Hi-C and found that long-range interactions are highly nonrandom; the same DNA fragments are often found interacting together. We then show using ChIP data that these interactions can be explained by the action of the CCCTC-binding factor (CTCF). These CTCF-mediated interactions are found both within chromosomes and in between different chromosomes. This makes CTCF a major organizer of both the structure of the chromosomal fiber within each individual chromosome and of the chromosome territories within the cell nucleus.


Conflict of interest statement

The authors declare that they have no conflict of interest.

Figures

Figure 1
Figure 1
Comparison between the interaction network obtained in the Lieberman-Aiden et al (2009) experiment and a randomized interaction network. (A) Schematic drawing of an interaction network: nodes represent interacting fragments and each link between two nodes corresponds to one interaction read. (B) Distribution (Log10 scale) of the number of reads obtained between each pair of nodes in the actual data (red triangles) and in a randomized network (green dots, error bars correspond to a 95% confidence interval computed on 100 random networks). The statistical difference between those two distributions was assessed using the Kolmogorov–Smirnov test on the same plot normalized by the total number of interaction pairs. The obtained P-value was lower than 2.2 × 10⁻¹⁶.
Figure 2
Figure 2
CTCF presence is correlated with the most frequently observed interactions in the human genome. (A) Number of fragments that are present in at least n interaction reads in the Hi-C experiments on lymphoblastoid cell line (log scale on the y-axis). In black, all interactions are considered. In green, only inter-chromosomal interactions are considered. (B) The percentage of interacting fragments that contain at least one CTCF site is presented as a function of n. In black, all interactions are considered. In green, only interchromosomal interactions are considered.
Figure 3
Figure 3
The correlation between strong chromosomal interactions and each of the three data sets taken from CTCFBSDB. In red: data set of Kim et al (2007), in green: data set of Barski et al (2007) and in blue data set of Xie et al (2007) (A) Venn diagram presenting number of fragments containing one or more CTCF-binding site for each data set and corresponding overlap. (B) The percentage of interacting fragments that contain at least one CTCF site is presented as a function of n. In black, all three data sets are combined. In colored, each data set is used separately.
Figure 4
Figure 4
Correlation between strongly interacting fragments and the presence of specific DNA-binding factors. (A) CTCF versus other ChIP-Seq data sets. SRF and GABP genomic locations were mapped on three different cell types: in red, Hep G2 cells; in blue, HeLa cells and in green, lymphoblastoid cells. (B) Same analysis conducted with computationally predicted binding sites for transcription factors from the TRANSFAC database. The black line and error bars correspond to random sequences of 20 bp (see Materials and methods section).

Similar articles

Cited by

References

    1. Bao L, Zhou M, Cui Y (2008) CTCFBSDB: a CTCF-binding site database for characterization of vertebrate genomic insulators. Nucleic Acids Res 36: D83–D87 - PMC - PubMed
    1. Barski A, Cuddapah S, Cui K, Roh TY, Schones DE, Wang Z, Wei G, Chepelev I, Zhao K (2007) High-resolution profiling of histone methylations in the human genome. Cell 129: 823–837 - PubMed
    1. de Laat W, Grosveld F (2007) Inter-chromosomal gene regulation in the mammalian cell nucleus. Curr Opin Genet Dev 17: 456–464 - PubMed
    1. Hertz GZ, Stormo GD (1999) Identifying DNA and protein patterns with statistically significant alignments of multiple sequences. Bioinformatics 15: 563–577 - PubMed
    1. Hou C, Dale R, Dean A (2010) Cell type specificity of chromatin organisation mediated by CTCF and cohesin. Proc Natl Acad Sci USA 107: 3651–3656 - PMC - PubMed

Publication types

MeSH terms