. 2010 Nov 2:1:104.
doi: 10.1038/ncomms1104.

Global distribution of the sickle cell gene and geographical confirmation of the malaria hypothesis

Affiliations
Free PMC article

Global distribution of the sickle cell gene and geographical confirmation of the malaria hypothesis

Frédéric B Piel et al. Nat Commun. .
Free PMC article

Abstract

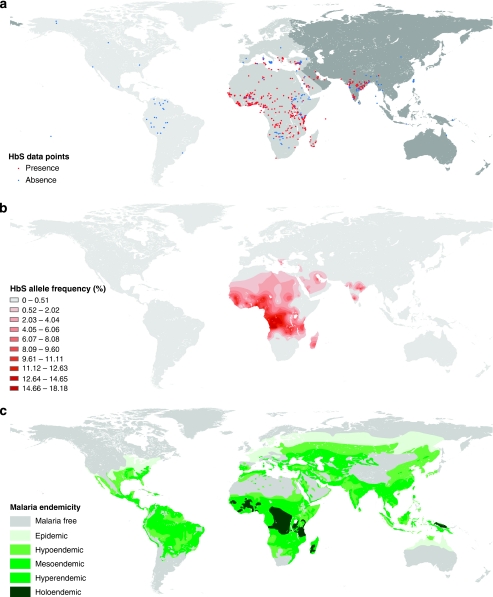
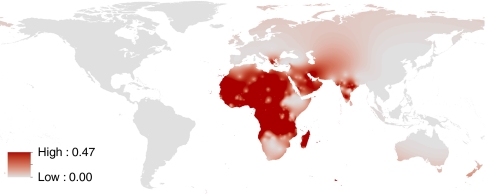
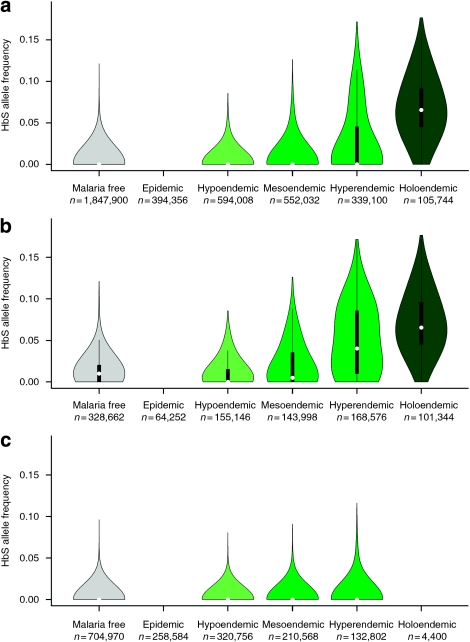
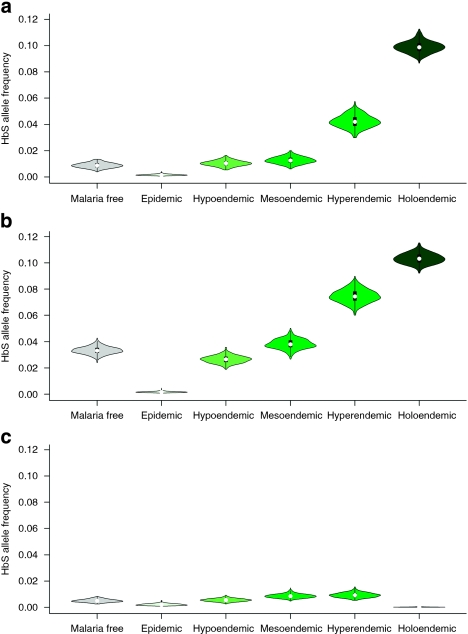
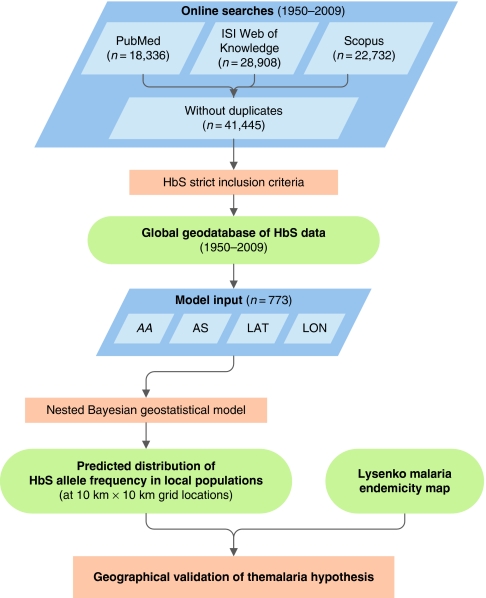
It has been 100 years since the first report of sickle haemoglobin (HbS). More than 50 years ago, it was suggested that the gene responsible for this disorder could reach high frequencies because of resistance conferred against malaria by the heterozygous carrier state. This traditional example of balancing selection is known as the 'malaria hypothesis'. However, the geographical relationship between the transmission intensity of malaria and associated HbS burden has never been formally investigated on a global scale. Here, we use a comprehensive data assembly of HbS allele frequencies to generate the first evidence-based map of the worldwide distribution of the gene in a Bayesian geostatistical framework. We compare this map with the pre-intervention distribution of malaria endemicity, using a novel geostatistical area-mean comparison. We find geographical support for the malaria hypothesis globally; the relationship is relatively strong in Africa but cannot be resolved in the Americas or in Asia.


Figures

Figure 1
Figure 1. Global distribution of the sickle cell gene.
(a) Distribution of the data points. Red dots represent the presence and blue dots the absence of the HbS gene. The regional subdivisions were informed by Weatherall and Clegg, and are as follows: the Americas (light grey), Africa, including the western part of Saudi Arabia, and Europe (medium grey) and Asia (dark grey); (b) Raster map of HbS allele frequency (posterior median) generated by a Bayesian model-based geostatistical framework. The Jenks optimized classification method was used to define the classes; (c) The historical map of malaria endemicity was digitized from its source using the method outlined in Hay et al. The classes are defined by parasite rates (PR2−10, the proportion of 2- up to 10-year olds with the parasite in their peripheral blood): malaria free, PR2−10=0; epidemic, PR2−10=0; hypoendemic, PR2−10<0.10; mesoendemic, PR2−10≥0.10 and <0.50; hyperendemic, PR2−10≥0.50 and <0.75; holoendemic, PR0−1≥0.75 (this class was measured in 0- up to 1-year olds).
Figure 2
Figure 2. Map of the uncertainty of the HbS allele frequency prediction.
Interval between the 2.5 and 97.5% quantiles (95% probability) of the per-pixel predicted allele frequency using a continuous scale.
Figure 3
Figure 3. Comparison of the distribution of HbS and malaria.
Violin plots of the predicted median HbS allele frequency for each pixel, within each malaria endemicity class, for the world (a), Africa and Europe (b) and Asia (c). The plot for the Americas is not shown as the predicted median was in the lowest histogram bin (between 0 and 0.5%) everywhere. The green areas match the colours used in the historical map of malaria endemicity (Fig. 1c) and show a smoothed approximation of the frequency distribution (a kernel density plot) of the predicted allele frequency within each endemicity class. The black central bar indicates the interquartile range and the white circles indicate the median values. The plots have been adjusted to an equal-area projection of the Earth.
Figure 4
Figure 4. Quantitative validation of the geographical support for the malaria hypothesis.
Violin plots of the predictive distribution of the areal mean of HbS prevalence over each endemicity region, for the world (a), Africa and Europe (b) and Asia (c). The green areas match the colours used in the historical map of malaria endemicity (Fig. 1c) and show a smoothed approximation of the frequency distribution (a kernel density plot) of the predicted allele frequency within each endemicity class. The black central bar indicates the interquartile range and the white circles indicate the median values. The plots have been adjusted to an equal-area projection of the Earth.
Figure 5
Figure 5. Schematic overview of the data collection and mapping processes.
Blue diamonds describe input data. Orange boxes denote models and experimental procedures. Green rods indicate output data.

Similar articles

Cited by

References

    1. Herrick J. B. Peculiar, elongated and sickle-shaped red blood corpuscles in a case of severe anemia. Arch. Intern. Med. 6, 517–521 (1910). - PMC - PubMed
    1. Serjeant G. R. & Serjeant B. E. Sickle Cell Disease (Oxford University Press, 2001).
    1. Weatherall D., Akinyanju O., Fucharoen S., Olivieri N. & Musgrove P. in Disease Control Priorities in Developing Countries (eds Jamison, D. T. et al..) Ch. 34, 663–680 (Oxford University Press, 2006).
    1. Modell B. & Darlison M. Global epidemiology of haemoglobin disorders and derived service indicators. Bull. World Health Organ. 86, 480–487 (2008). - PMC - PubMed
    1. Livingstone F. B. Frequencies of Hemoglobin Variants: Thalassemia, the Glucose-6-Phosphate Dehydrogenase Deficiency, G6Pd Variants and Ovalocytosis in Human Populations (Oxford University Press, 1985).