. 2010 Nov 2:1:108.
doi: 10.1038/ncomms1107.

A quantitative analysis of transmission efficiency versus intensity for malaria

Affiliations

A quantitative analysis of transmission efficiency versus intensity for malaria

David L Smith et al. Nat Commun. .

Abstract

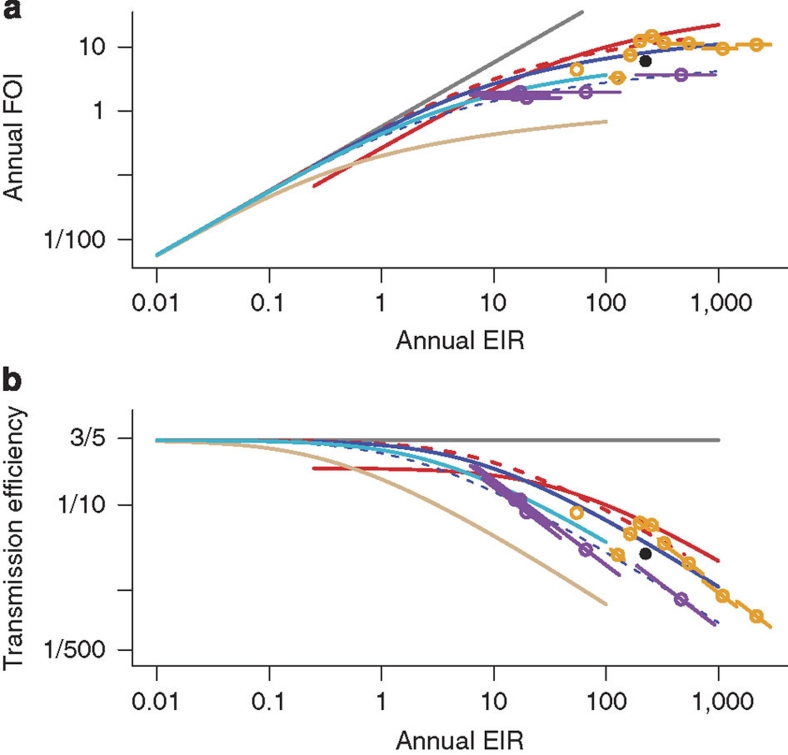
The relationship between malaria transmission intensity and efficiency is important for malaria epidemiology, for the design of randomized control trials that measure transmission or incidence as end points, and for measuring and modelling malaria transmission and control. Five kinds of studies published over the past century were assembled and reanalysed to quantify malaria transmission efficiency and describe its relation to transmission intensity, to understand the causes of inefficient transmission and to identify functions suitable for modelling mosquito-borne disease transmission. In this study, we show that these studies trace a strongly nonlinear relationship between malaria transmission intensity and efficiency that is parsimoniously described by a model of heterogeneous biting. When many infectious bites are concentrated on a few people, infections and parasite population structure will be highly aggregated affecting the immunoepidemiology of malaria, the evolutionary ecology of parasite life history traits and the measurement and stratification of transmission for control using entomological and epidemiological data.


Figures

Figure 1
Figure 1. The log likelihood of the proportion infected per bite after experimental challenge to infectious mosquitoes.
Data were assembled from the non-intervention arms of vaccine and drug trials in carefully monitored studies using human subjects previously unexposed to malaria (Table 1). The thin solid line uses only the data for which an exact number of infectious bites were reported. The two dashed lines use the upper or lower bound or the upper bound for the number of infectious bites. The solid line uses the average of the log likelihood from the upper and lower bound. In people previously unexposed to malaria, the ratio of the FOI to the EIR is ∼55%, with confidence limits between 47 and 63%.
Figure 2
Figure 2. Data and fitted models from the reanalysis of the synthetic cohort study.
The top two panels have replotted the original data and results of the reanalysis in two ways: (a) the daily FOI and (b) transmission efficiency versus the daily EIR. Each point is an estimate of the daily FOI or transmission efficiency; the bars show the confidence intervals on the FOI by the exact test on the attack rate. Lines show the best fits for the fitted models: solid black is the rooted linear model (b≈1/20), dashed black shows the slope from the unrooted linear model (b≈1/37) and red shows the best-fit heterogeneous biting model. The grey line is plotted for reference to show the relationship predicted by the Ross–Macdonald model (that is, a linear relationship), assuming b=0.55. (c) Under the assumption that EIR was biased by a factor of two, the analysis was redone and plotted as transmission efficiency. The fitted slopes for the rooted (solid black) and unrooted (dashed black) linear models are different (b≈1/10 or 1/20, respectively). The dashed red line shows the new best fit for the heterogeneous biting model. The solid red line and grey lines were replotted from b for reference.
Figure 3
Figure 3. The annual FOI and transmission efficiency estimated from cross-sectional PR surveys.
The data have been plotted in two ways: (a) the estimated annual FOI and (b) transmission efficiency plotted versus the log of EIR. Each point represents a single study. When several estimates of the EIR or the FOI were reported, a 'spider' was plotted with its centre at the arithmetic mean and legs that connect the center to each one of the estimates. The solid blue line shows a good fit to the data using Equation 1, plotted with b=0.55, α=4.6 and t=43 days. The dashed blue line was drawn with longer times and much higher degrees of heterogeneous biting (that is, with α=10 and t=60 days). Also plotted in red is the heterogeneous biting model fitted to the synthetic cohort study, which serves as an upper bound for this data. The grey line is plotted for reference to show the relationship predicted by the Ross–Macdonald model, assuming b=0.55.
Figure 4
Figure 4. Analysis of a set of linked cross-sectional serological and parasite surveys.
The data have been plotted in two ways: (a) the estimated annual SCR (tan circles) and FOI (cyan squares) and (b) transmission efficiency based on these estimates plotted versus the log of EIR. The tan line (SCR) was plotted with b=0.55, α=4.6 and t=2 years, and the cyan line (FOI by PfPR) was plotted with b=0.55, α=4.6 and t=0.25 years. Also plotted is the predicted relationship from the Ross–Macdonald model, assuming b=0.55 (grey).
Figure 5
Figure 5. Estimated annual FOI and transmission efficiency from all the studies plotted versus annual EIR.
The data have been plotted in two ways: (a) FOI data from three longitudinal studies in Idete (orange), Garki (purple) and Dielmo (black) have been plotted without further analysis versus the annual EIR on log-log scale and (b) transmission efficiency was also plotted for those same studies. Also plotted are the Ross–Macdonald model assuming b=0.55 (grey), the reanalysis of the synthetic cohort study (red, see Figure 2), the fit to the estimated FOI from the cross-sectional PR surveys (blue, see Figure 3) and the fits to estimated FOI and SCR from the paired cross-sectional surveys (cyan and tan, see Figure 4).

References

    1. Ross R. The Prevention of Malaria 2nd edn (John Murray, 1911).
    1. Macdonald G. The Epidemiology and Control of Malaria (Oxford University Press, 1957).
    1. Lotka A. J. Contributions to the analysis of malaria epidemiology. Am. J. Hyg. 3, 1–121 (1923).
    1. Smith D. L., McKenzie F. E., Snow R. W. & Hay S. I. Revisiting the basic reproductive number for malaria and its implications for malaria control. PLoS Biol. 5, e42 (2007). - PMC - PubMed
    1. Garrett-Jones C. Prognosis for interruption of malaria transmission through assessment of the mosquito's vectorial capacity. Nature 204, 1173–1175 (1964). - PubMed