

Feedback modeling of non-esterified fatty acids in rats after nicotinic acid infusions
- PMID: 21046209
- PMCID: PMC3020290
- DOI: 10.1007/s10928-010-9172-2
Feedback modeling of non-esterified fatty acids in rats after nicotinic acid infusions
Abstract
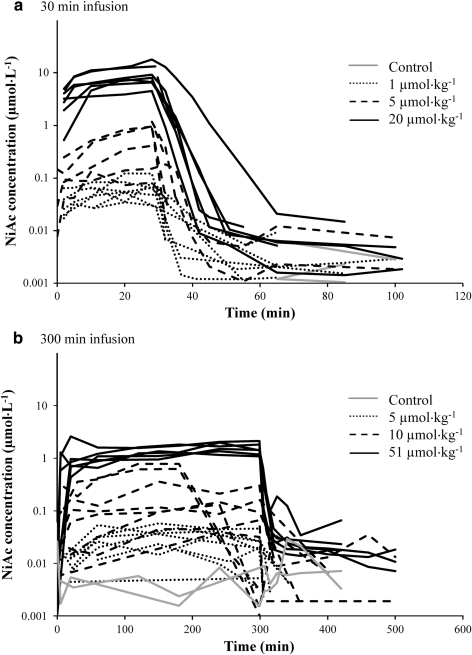
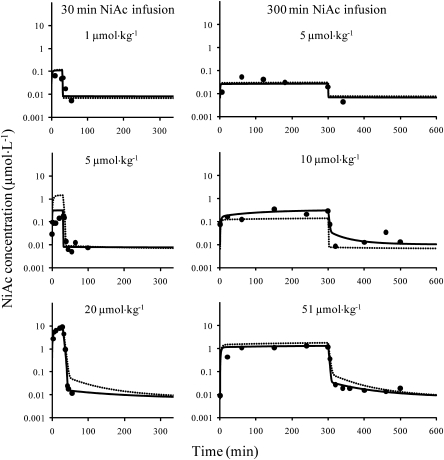
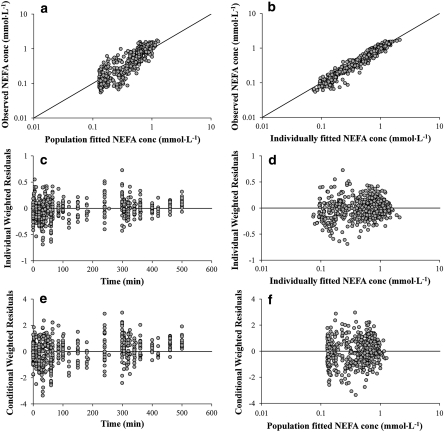
A feedback model was developed to describe the tolerance and oscillatory rebound seen in non-esterified fatty acid (NEFA) plasma concentrations following intravenous infusions of nicotinic acid (NiAc) to male Sprague-Dawley rats. NiAc was administered as an intravenous infusion over 30 min (0, 1, 5 or 20 μmol kg(-1) of body weight) or over 300 min (0, 5, 10 or 51 μmol kg(-1) of body weight), to healthy rats (n = 63), and serial arterial blood samples were taken for measurement of NiAc and NEFA plasma concentrations. Data were analyzed using nonlinear mixed effects modeling (NONMEM). The disposition of NiAc was described by a two-compartment model with endogenous turnover rate and two parallel capacity-limited elimination processes. The plasma concentration of NiAc was driving NEFA (R) turnover via an inhibitory drug-mechanism function acting on the formation of NEFA. The NEFA turnover was described by a feedback model with a moderator distributed over a series of transit compartments, where the first compartment (M (1)) inhibited the formation of R and the last compartment (M ( N )) stimulated the loss of R. All processes regulating plasma NEFA concentrations were assumed to be captured by the moderator function. The potency, IC (50), of NiAc was 45 nmol L(-1), the fractional turnover rate k ( out ) was 0.41 L mmol(-1) min(-1) and the turnover rate of moderator k ( tol ) was 0.027 min(-1). A lower physiological limit of NEFA was modeled as a NiAc-independent release (k ( cap )) of NEFA into plasma and was estimated to 0.032 mmol L(-1) min(-1). This model can be used to provide information about factors that determine the time-course of NEFA response following different modes, rates and routes of administration of NiAc. The proposed model may also serve as a preclinical tool for analyzing and simulating drug-induced changes in plasma NEFA concentrations after treatment with NiAc or NiAc analogues.
Figures


Similar articles
-
Challenges of a mechanistic feedback model describing nicotinic acid-induced changes in non-esterified fatty acids in rats.J Pharmacokinet Pharmacodyn. 2013 Aug;40(4):497-512. doi: 10.1007/s10928-013-9325-1. Epub 2013 Jul 4. J Pharmacokinet Pharmacodyn. 2013. PMID: 23824920
-
Feedback modeling of non-esterified fatty acids in obese Zucker rats after nicotinic acid infusions.J Pharmacokinet Pharmacodyn. 2013 Dec;40(6):623-38. doi: 10.1007/s10928-013-9335-z. Epub 2013 Oct 10. J Pharmacokinet Pharmacodyn. 2013. PMID: 24114415
-
Turnover modeling of non-esterified fatty acids in rats after multiple intravenous infusions of nicotinic acid.Dose Response. 2009 Apr 8;7(3):247-69. doi: 10.2203/dose-response.08-028.Isaksson. Dose Response. 2009. PMID: 19809543 Free PMC article.
-
Quantitative analysis of rate and extent of tolerance of biomarkers: application to nicotinic acid-induced changes in non-esterified fatty acids in rats.Eur J Pharm Sci. 2011 Oct 9;44(3):250-64. doi: 10.1016/j.ejps.2011.08.005. Epub 2011 Aug 11. Eur J Pharm Sci. 2011. PMID: 21856416
-
The nicotinic acid receptor--a new mechanism for an old drug.Lancet. 2004 Jun 5;363(9424):1892-4. doi: 10.1016/S0140-6736(04)16359-9. Lancet. 2004. PMID: 15183629 Review.
Cited by
-
Mixed Effects Modeling Using Stochastic Differential Equations: Illustrated by Pharmacokinetic Data of Nicotinic Acid in Obese Zucker Rats.AAPS J. 2015 May;17(3):586-96. doi: 10.1208/s12248-015-9718-8. Epub 2015 Feb 19. AAPS J. 2015. PMID: 25693487 Free PMC article.
-
Modeling of free fatty acid dynamics: insulin and nicotinic acid resistance under acute and chronic treatments.J Pharmacokinet Pharmacodyn. 2017 Jun;44(3):203-222. doi: 10.1007/s10928-017-9512-6. Epub 2017 Feb 21. J Pharmacokinet Pharmacodyn. 2017. PMID: 28224315 Free PMC article.
-
Joint feedback analysis modeling of nonesterified fatty acids in obese Zucker rats and normal Sprague-Dawley rats after different routes of administration of nicotinic acid.J Pharm Sci. 2014 Aug;103(8):2571-84. doi: 10.1002/jps.24077. Epub 2014 Jul 1. J Pharm Sci. 2014. PMID: 24986056 Free PMC article.
-
Modeling energy intake by adding homeostatic feedback and drug intervention.J Pharmacokinet Pharmacodyn. 2015 Feb;42(1):79-96. doi: 10.1007/s10928-014-9399-4. Epub 2014 Nov 12. J Pharmacokinet Pharmacodyn. 2015. PMID: 25388764
-
Challenges of a mechanistic feedback model describing nicotinic acid-induced changes in non-esterified fatty acids in rats.J Pharmacokinet Pharmacodyn. 2013 Aug;40(4):497-512. doi: 10.1007/s10928-013-9325-1. Epub 2013 Jul 4. J Pharmacokinet Pharmacodyn. 2013. PMID: 23824920
References
MeSH terms
Substances
LinkOut - more resources
Full Text Sources
Other Literature Sources
Medical
Miscellaneous
