

Assessment of across-muscle coherence using multi-unit vs. single-unit recordings
- PMID: 21046368
- PMCID: PMC5706539
- DOI: 10.1007/s00221-010-2455-4
Assessment of across-muscle coherence using multi-unit vs. single-unit recordings
Abstract
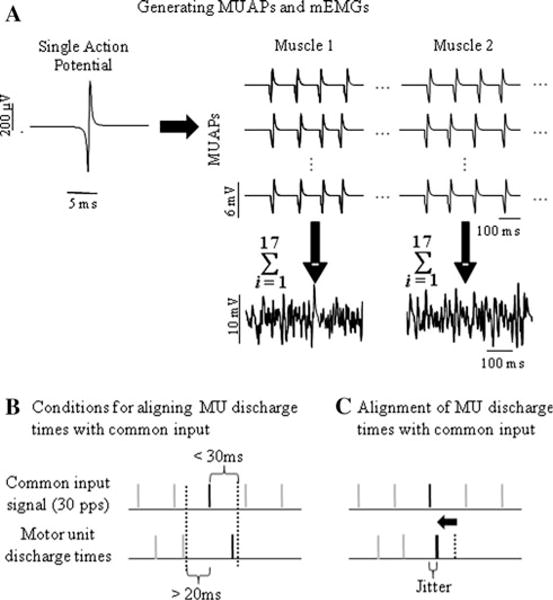
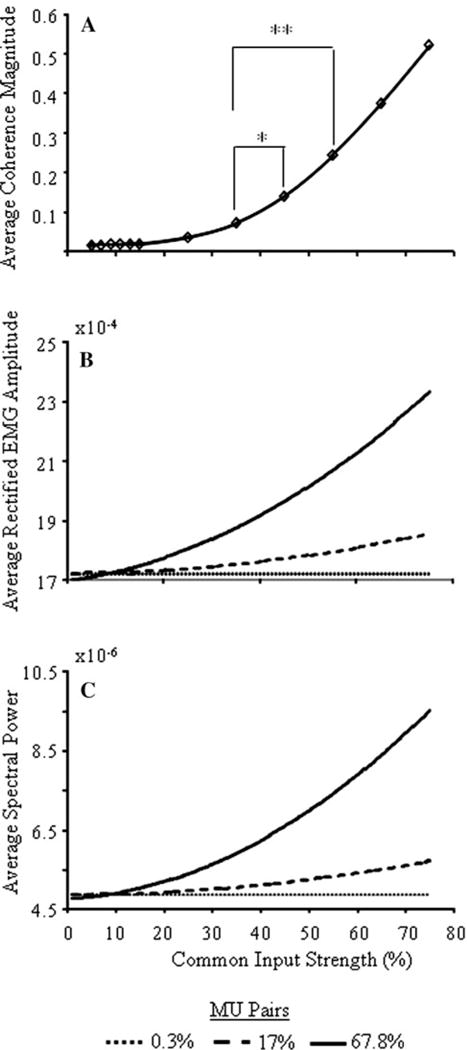
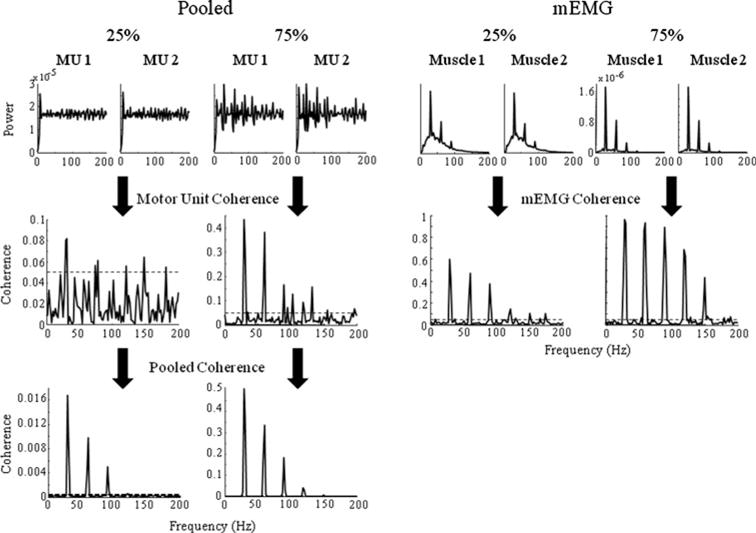
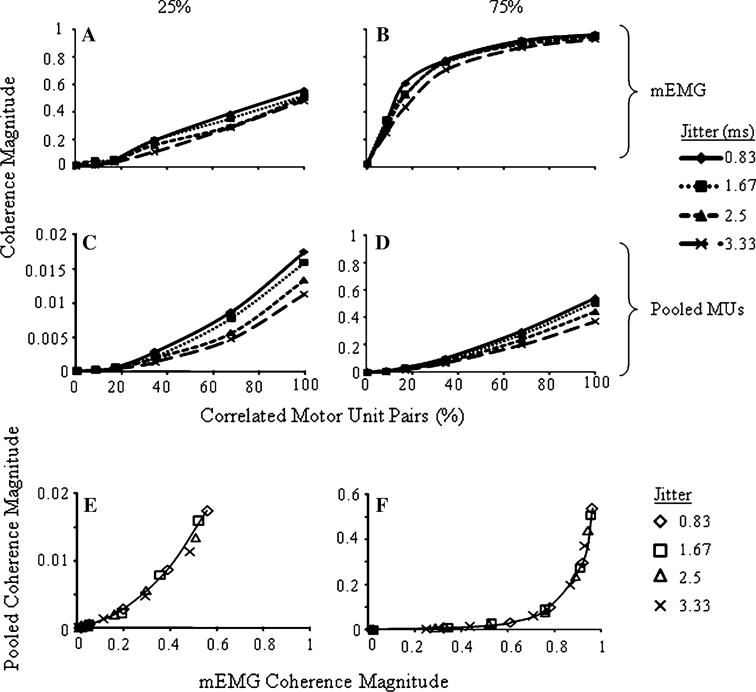
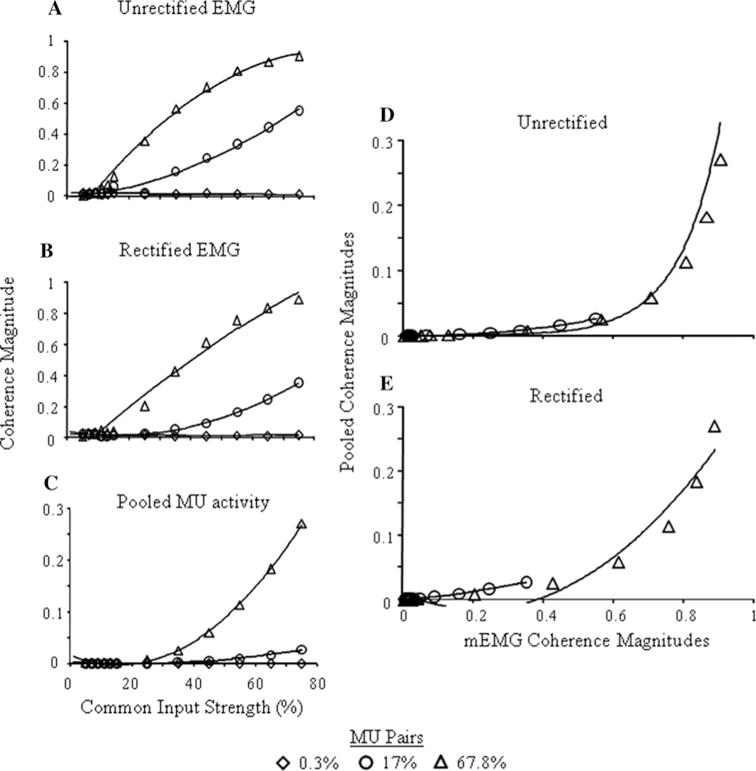
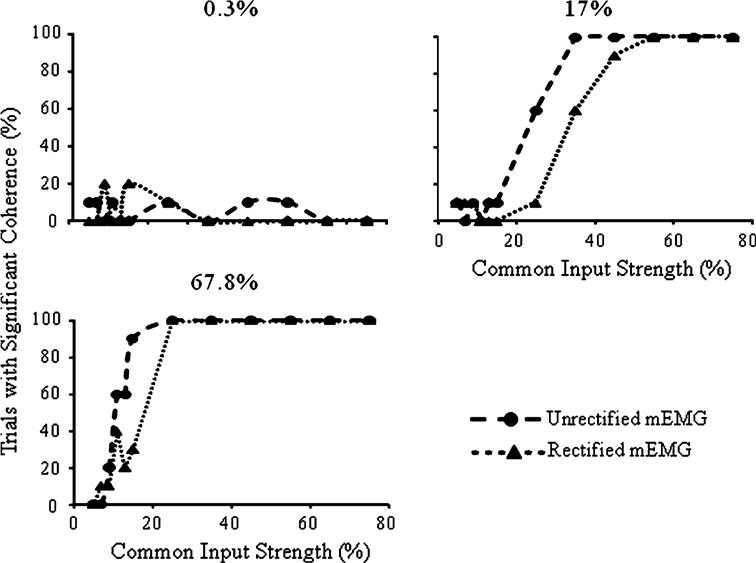
Coherence between electromyographic (EMG) signals has been used to identify correlated neural inputs to motor units (MUs) innervating different muscles. Simulations using a motor-unit model (Fuglevand et al. 1992) were performed to determine the ability of coherence between two multi-unit EMGs (mEMG) to detect correlated MU activity and the range of correlation strengths in which mEMG coherence can be usefully employed. Coherence between motor-unit and mEMG activities in two muscles was determined as we varied the strength of a 30-Hz periodic common input, the number of correlated MU pairs and variability of MU discharge relative to the common input. Pooled and mEMG coherence amplitudes positively and negatively accelerated, respectively, toward the strongest and most widespread correlating inputs. Furthermore, the relation between pooled and mEMG coherence was also nonlinear and was essentially the same whether correlation strength varied by changing common input strength or its distribution. However, the most important finding is that while the mEMG coherence saturates at the strongest common input strengths, this occurs at common input strengths greater than found in most physiological studies. Thus, we conclude that mEMG coherence would be a useful measure in many experimental conditions and our simulation results suggest further guidelines for using and interpreting coherence between mEMG signals.
Figures
Similar articles
-
A new method for the extraction and classification of single motor unit action potentials from surface EMG signals.J Neurosci Methods. 2004 Jul 30;136(2):165-77. doi: 10.1016/j.jneumeth.2004.01.002. J Neurosci Methods. 2004. PMID: 15183268
-
Motor unit synchronization measured by cross-correlation is not influenced by short-term strength training of a hand muscle.Exp Brain Res. 2006 Nov;175(4):745-53. doi: 10.1007/s00221-006-0724-z. Epub 2006 Oct 19. Exp Brain Res. 2006. PMID: 17051382
-
Low-frequency common modulation of soleus motor unit discharge is enhanced during postural control in humans.Exp Brain Res. 2006 Nov;175(4):584-95. doi: 10.1007/s00221-006-0575-7. Epub 2006 Jun 17. Exp Brain Res. 2006. PMID: 16783557
-
Surface EMG and fatigue.Phys Med Rehabil Clin N Am. 1998 Nov;9(4):933-47, viii-ix. Phys Med Rehabil Clin N Am. 1998. PMID: 9894104 Review.
-
Does the frequency content of the surface mechanomyographic signal reflect motor unit firing rates? A brief review.J Electromyogr Kinesiol. 2007 Feb;17(1):1-13. doi: 10.1016/j.jelekin.2005.12.002. Epub 2006 Feb 23. J Electromyogr Kinesiol. 2007. PMID: 16497517 Review.
Cited by
-
Neural bases of hand synergies.Front Comput Neurosci. 2013 Apr 8;7:23. doi: 10.3389/fncom.2013.00023. eCollection 2013. Front Comput Neurosci. 2013. PMID: 23579545 Free PMC article.
-
Hand dominance during constant force isometric contractions: evidence of different cortical drive commands.Eur J Appl Physiol. 2012 Aug;112(8):2999-3006. doi: 10.1007/s00421-011-2278-4. Epub 2011 Dec 15. Eur J Appl Physiol. 2012. PMID: 22170017
-
Neural Mechanisms Underlying High-Frequency Vestibulocollic Reflexes In Humans And Monkeys.J Neurosci. 2020 Feb 26;40(9):1874-1887. doi: 10.1523/JNEUROSCI.1463-19.2020. Epub 2020 Jan 20. J Neurosci. 2020. PMID: 31959700 Free PMC article.
-
Modifying motor unit territory placement in the Fuglevand model.Med Biol Eng Comput. 2017 Nov;55(11):2015-2025. doi: 10.1007/s11517-017-1645-7. Epub 2017 Apr 8. Med Biol Eng Comput. 2017. PMID: 28390003
References
-
- Amjad AM, Halliday DM, Rosenberg JR, Conway BA. An extended difference of coherence test for comparing and combining several independent coherence estimates: theory and application to the study of motor units and physiological tremor. J Neurosci Methods. 1997;73:69–79. - PubMed
-
- Ashby P, Zilm D. Relationship between EPSP shape and cross-correlation profile explored by computer simulation for studies on human motoneurons. Exp Brain Res. 1982;47:33–40. - PubMed
-
- Baker SN, Kilner JM, Pinches EM, Lemon RN. The role of synchrony and oscillations in the motor output. Exp Brain Res. 1999;128:109–117. - PubMed
-
- Binder MD, Powers RK. Relationship between simulated common synaptic input and discharge synchrony in cat spinal motoneurons. J Neurophysiol. 2001;86:2266–2275. - PubMed
-
- Christakos CN. Analysis of synchrony (correlations) in neural populations by means of unit-to-aggregate coherence computation. Neurosci. 1994;58:43–57. - PubMed
Publication types
MeSH terms
Grants and funding
LinkOut - more resources
Full Text Sources
Research Materials
