

Thermodynamics of cooperative DNA recognition at a replication origin and transcription regulatory site
- PMID: 21047141
- PMCID: PMC3091369
- DOI: 10.1021/bi1014908
Thermodynamics of cooperative DNA recognition at a replication origin and transcription regulatory site
Abstract
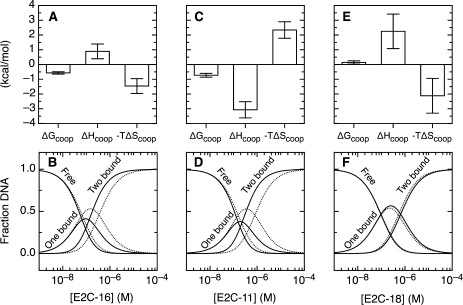
Binding cooperativity guides the formation of protein-nucleic acid complexes, in particular those that are highly regulated such as replication origins and transcription sites. Using the DNA binding domain of the origin binding and transcriptional regulator protein E2 from human papillomavirus type 16 as model, and through isothermal titration calorimetry analysis, we determined a positive, entropy-driven cooperativity upon binding of the protein to its cognate tandem double E2 site. This cooperativity is associated with a change in DNA structure, where the overall B conformation is maintained. Two homologous E2 domains, those of HPV18 and HPV11, showed that the enthalpic-entropic components of the reaction and DNA deformation can diverge. Because the DNA binding helix is almost identical in the three domains, the differences must lie dispersed throughout this unique dimeric β-barrel fold. This is in surprising agreement with previous results for this domain, which revealed a strong coupling between global dynamics and DNA recognition.
Figures


Similar articles
-
The structural basis of DNA target discrimination by papillomavirus E2 proteins.J Biol Chem. 2000 Oct 6;275(40):31245-54. doi: 10.1074/jbc.M004541200. J Biol Chem. 2000. PMID: 10906136
-
Indirect DNA readout on the protein side: coupling between histidine protonation, global structural cooperativity, dynamics, and DNA binding of the human papillomavirus type 16 E2C domain.J Mol Biol. 2009 May 1;388(2):327-44. doi: 10.1016/j.jmb.2009.03.013. Epub 2009 Mar 12. J Mol Biol. 2009. PMID: 19285507
-
Indirect readout of DNA sequence by papillomavirus E2 proteins depends upon net cation uptake.J Mol Biol. 2006 Apr 21;358(1):224-40. doi: 10.1016/j.jmb.2006.01.093. Epub 2006 Feb 14. J Mol Biol. 2006. PMID: 16513133
-
Analysis of cooperativity by isothermal titration calorimetry.Int J Mol Sci. 2009 Aug 4;10(8):3457-77. doi: 10.3390/ijms10083457. Int J Mol Sci. 2009. PMID: 20111687 Free PMC article. Review.
-
Eukaryotic transcriptional regulatory complexes: cooperativity from near and afar.Curr Opin Struct Biol. 2003 Feb;13(1):40-8. doi: 10.1016/s0959-440x(03)00012-5. Curr Opin Struct Biol. 2003. PMID: 12581658 Review.
Cited by
-
DNA breathing integration with deep learning foundational model advances genome-wide binding prediction of human transcription factors.Nucleic Acids Res. 2024 Oct 28;52(19):e91. doi: 10.1093/nar/gkae783. Nucleic Acids Res. 2024. PMID: 39271116 Free PMC article.
-
Cooperative binding of transcription factors promotes bimodal gene expression response.PLoS One. 2012;7(9):e44812. doi: 10.1371/journal.pone.0044812. Epub 2012 Sep 12. PLoS One. 2012. PMID: 22984566 Free PMC article.
-
Integration and global analysis of isothermal titration calorimetry data for studying macromolecular interactions.Nat Protoc. 2016 May;11(5):882-94. doi: 10.1038/nprot.2016.044. Epub 2016 Apr 7. Nat Protoc. 2016. PMID: 27055097 Free PMC article.
-
Examining DNA breathing with pyDNA-EPBD.Bioinformatics. 2023 Nov 1;39(11):btad699. doi: 10.1093/bioinformatics/btad699. Bioinformatics. 2023. PMID: 37991847 Free PMC article.
-
SEDPHAT--a platform for global ITC analysis and global multi-method analysis of molecular interactions.Methods. 2015 Apr;76:137-148. doi: 10.1016/j.ymeth.2014.11.012. Epub 2014 Dec 2. Methods. 2015. PMID: 25477226 Free PMC article. Review.
References
-
- Liu B.; Alberts B. M. (1995) Head-on collision between a DNA replication apparatus and RNA polymerase transcription complex. Science 267, 1131–1137. - PubMed
-
- Flint S. J., Enquist L. W., Racaniello V. R., and Skalka A. M. (2008) Transcription strategies: DNA templates. In Principles of Virology, 3rd ed., pp 240−287, ASM Press, Washington, DC.
-
- Flint S. J., Enquist L. W., Racaniello V. R., and Skalka A. M. (2008) Genome replication strategies: DNA viruses. In Principles of Virology, 3rd ed., pp 288−333, ASM Press, Washington, DC.
-
- Kelly T. J. (1988) SV40 DNA replication. J. Biol. Chem. 263, 17889–17892. - PubMed
Publication types
MeSH terms
Substances
Grants and funding
LinkOut - more resources
Full Text Sources
Other Literature Sources
