. 2011 Jan;105(1):235-48.
doi: 10.1152/jn.00493.2010. Epub 2010 Nov 3.

GAD67-GFP+ neurons in the Nucleus of Roller: a possible source of inhibitory input to hypoglossal motoneurons. I. Morphology and firing properties

Affiliations

GAD67-GFP+ neurons in the Nucleus of Roller: a possible source of inhibitory input to hypoglossal motoneurons. I. Morphology and firing properties

J F M van Brederode et al. J Neurophysiol. 2011 Jan.

Abstract

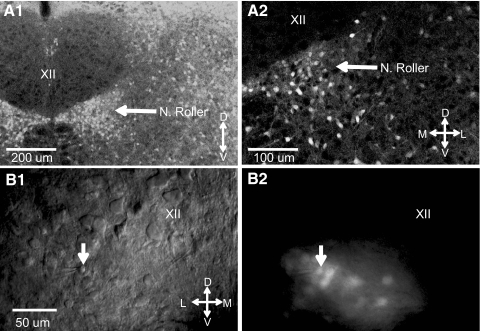
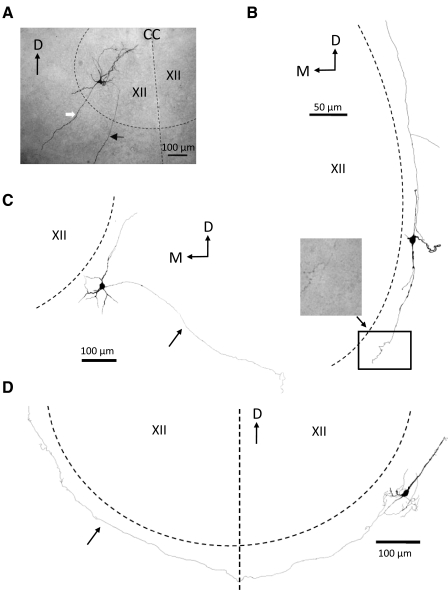
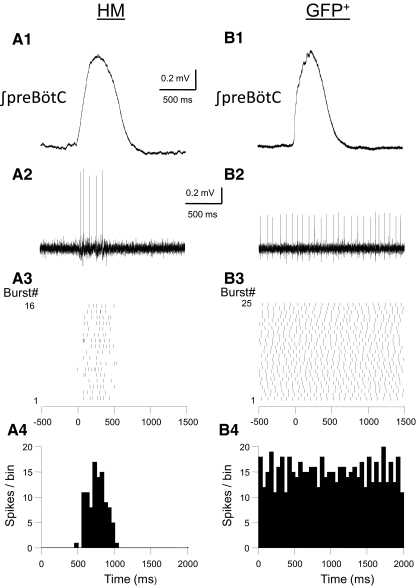
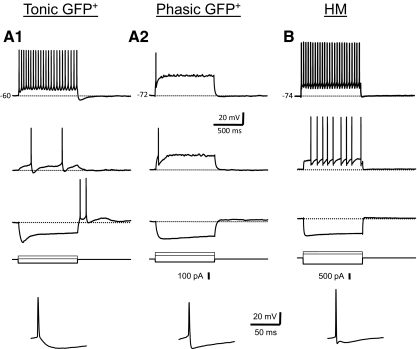
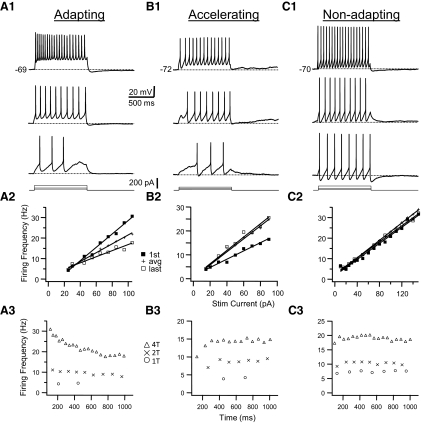
In this study we examined the electrophysiological and morphological properties of inhibitory neurons located just ventrolateral to the hypoglossal motor (XII) nucleus in the Nucleus of Roller (NR). In vitro experiments were performed on medullary slices derived from postnatal day 5 (P5) to P15 GAD67-GFP knock-in mouse pups. on cell recordings from GFP+ cells in NR in rhythmic slices revealed that these neurons are spontaneously active, although their spiking activity does not exhibit inspiratory phase modulation. Morphologically, GFP+ cells were bi- or multipolar cells with small- to medium-sized cell bodies and small dendritic trees that were often oriented parallel to the border of the XII nucleus. GFP+ cells were classified as either tonic or phasic based on their firing responses to depolarizing step current stimulation in whole cell current clamp. Tonic GFP+ cells fired a regular train of action potentials (APs) throughout the duration of the pulse and often showed rebound spikes after a hyperpolarizing step. In contrast, phasic GFP+ neurons did not fire throughout the depolarizing current step but instead fired fewer than four APs at the onset of the pulse or fired multiple APs, but only after a marked delay. Phasic cells had a significantly smaller input resistance and shorter membrane time constant than tonic GFP+ cells. In addition, phasic GFP+ cells differed from tonic cells in the shape and time course of their spike afterpotentials, the minimum firing frequency at threshold current amplitude, and the slope of their current-frequency relationship. These results suggest that GABAergic neurons in the NR are morphologically and electrophysiologically heterogeneous cells that could provide tonic inhibitory synaptic input to HMs.


Figures

Fig. 1.
Fig. 1.
Nucleus of Roller (NR), located just ventrolateral to the hypoglossal motor nucleus (XII), contains a high-density of GAD67-GFP+ neurons. A1: confocal microscope image of a nonrhythmic transverse brain stem slice shows the presence in the NR of a high density of GAD67-GFP+ neurons. The arrow points to the NR, which is the large overall cluster of GAD67-GFP+ neurons just ventrolateral to XII (see also Fig. 91 in Franklin and Paxinos 1997). The XII is almost devoid of green fluorescence protein (GFP)–containing neurons. A2: higher magnification confocal microscope image of the NR from the same brain stem slice as in A1. Data in A from a postnatal day 7 (P7) mouse. B1: infrared differential interference contrast (IR-DIC) image of a nonrhythmic living transverse brain stem slice (250 μm thick) shows the tip of a patch recording electrode and the recorded GAD67-GFP+ neuron in the NR. The downward arrow points to the recorded GAD67-GFP+ neuron. B2: same image as in B1, but in fluorescence, shows that the recorded neuron in B1 is GFP positive. Data from a P5 mouse. Scale is the same as that in B1 and B2, orientation indicators shown (D, dorsal; L, lateral; M, medial; V, ventral).
Fig. 2.
Fig. 2.
Examples of several morphological types of biocytin-filled mouse brain stem neurons examined in this study. A: photomicrograph of a HM filled with biocytin through a whole cell intracellular recording electrode (see methods). Slice (250 μm thick, nonrhythmic) was processed for biocytin with ABC-peroxidase as a whole mount. The cell body was located in the ventrolateral part of the XII nucleus (therefore likely a genioglossus motoneuron). The approximate boundary of the nucleus and the midline of the brain stem are indicated by the dashed black lines. The black arrow points toward the axon that, after leaving the nucleus, ran ventrolaterally in the slice toward the ventromedial surface of the slice. Note the absence of axon collaterals. The white arrow marks a large dendritic process that extends well beyond the boundary of the XII nucleus. B: camera lucida reconstruction of a multipolar biocytin-filled GFP+ cell located in the NR. The processes of this cell ran parallel to the boundary of the XII nucleus (dashed line marks approximate boundary location). Note the many axonal swellings—presumed synaptic contacts—in the photomicrograph of the terminal axonal arborization of this cell corresponding to the rectangular area in the drawing. C: camera lucida reconstruction of a multi-polar GFP+ cell located in the NR. Arrow points towards the axon which ran in a ventro-lateral direction in the slice away from the XII nucleus. D: camera lucida reconstruction of a multipolar GFP+ cell located in the NR. Arrow points to the cell axon which ran along the border of the XII nucleus (dashed line), crossed the midline (vertical dashed line), and ran along the border of the contralateral XII nucleus. D, dorsal; M, medial; CC, central canal; XII, hypoglossal nucleus.
Fig. 3.
Fig. 3.
Electrical stimulation of the perihypoglossal region of a nonrhythmic slice containing GAD67-GFP+ neurons results in γ-aminobutyric acid type A (GABAA) receptor-mediated synaptic currents in a hypoglossal motoneuron (HM). A1: IR-DIC image of slice shows electrical stimulation electrode in the perihypoglossal area just ventrolateral to the hypoglossal motor nucleus and the simultaneously recorded HM. Tip of the stimulating electrode indicated by the downward arrow, tip of patch recording electrode, and the recorded HM indicated by the upward arrow. A2: same image as that in A1, but in fluorescence showing the cluster of GAD67-GFP+ neurons in the NR. Upward and downward arrows in same position as in A1 and A2. Scale bar same in A1 and A2, orientation indicator shown (D, dorsal; L, lateral; M, medial; V, ventral; XII, hypoglossal motor nucleus). A3: average traces of GABAA receptor-mediated evoked IPSCs before and during bath application of SR95531 (0.5 μM). Experiments were performed in the presence of DNQX (10 μM) and strychnine (1 μM). Additional blockade of GABAA receptors with SR95531 almost completely abolished the evoked response. Data shown were obtained from the stimulating and recording electrodes shown in A and the responses shown are average responses to 10 consecutive stimuli in control and during SR95531 application; data taken from a P9 mouse. DNQX, 6,7-dinitroquinoxaline-2,3-dione; IPSC, inhibitory postsynaptic current; SR95531, 2-(3-carboxypropyl)-3-amino-6-methoxyphenyl-pyridazinium bromide.
Fig. 4.
Fig. 4.
Examples of the spiking patterns of an HM (A) and NR GFP+ neuron (B) recorded in rhythmically active mouse brain stem slices. A1 and B1, top traces: integrated electrical activity recorded with a field electrode placed in the ventral medulla in the vicinity of the pre-Bötzinger complex (preBötC). Raw field recordings were rectified, integrated, and aligned at the start of each inspiratory burst and averaged. A2 and B2: examples of the spikes recorded simultaneously with a cell-attached whole cell recording electrode during a single inspiratory burst. GFP+ cell was tonically active at a mean rate of 12.7 Hz (with a coefficient of variation [CV] of 0.16), whereas the HM fired only during the inspiratory burst. A3 and B3: raster plots for the spiking activity during 16 (left) and 25 (right) inspiratory cycles in the 2 neurons. The start of each inspiratory burst was aligned at 0 ms. Spike time occurrences in individual bursts were measured over a time interval starting 500 ms before the start of the burst for a total duration of 2 s. A4 and B4: peristimulus time histograms calculated for the raster plots shown above. Bin width: 50 ms. Note the prominent modulation of firing rate of the HM during the burst and the absence of inspiratory-burst modulated activity in the NR GFP+ cell.
Fig. 5.
Fig. 5.
Examples of the electrophysiological properties of the 2 main classes of GFP+ neurons (tonic, A1; phasic, A2) and HMs (B). Shown are membrane voltage responses (resting membrane potential indicated in the top traces) to 2 depolarizing steps of different amplitude (just-suprathreshold voltage response is shown in the middle) and a hyperpolarizing current step recorded at resting membrane potential (current pulses shown below voltage traces). Tonic cells fired a regular train of action potentials (APs) in response to depolarizing current pulses (A1). These cells often showed rebound APs at the end of a hyperpolarizing current pulse (bottom voltage trace). Note the large depolarizing “sag” in the membrane potential trace in response to the hyperpolarizing current step. Single APs (bottom trace; note expanded timescale) were followed by a relatively slow single hyperpolarizing afterpotential (AHP). Phasic cells (A2) fired a single AP or only a few APs (<4) at the start of the pulse. Single APs (bottom) were followed by a fast AHP, which slowly decayed back to threshold. HMs (B) fired a regular train of APs in response to depolarizing current pulses. Single APs were usually followed by 3 afterpotentials, a fast AHP, an afterdepolarization (ADP), and a medium AHP. All the data in this and the remaining figures were obtained from nonrhythmic slices in the presence of glutamatergic, GABAergic, and glycinergic antagonists (see methods).
Fig. 6.
Fig. 6.
Examples of the firing patterns in response to step-current pulses in a tonic adapting (column A), tonic accelerating (column B), and a tonic nonadapting (column C) GFP+ interneuron. Top panel (A1–C1): for each cell membrane voltage responses to 1,000-ms-long depolarizing current pulses at 3 different amplitudes are shown. Current amplitude increases from bottom to top. The smallest current pulse that resulted in repetitive firing is the threshold current (1T). Resting membrane potential is indicated in the top trace of each panel. Middle panel (A2–C2): relationship between instantaneous firing frequency and current amplitude (f–I plot) for the cells shown in the top panel. Plotted are the firing frequency for the first spike interval in the train (first; filled squares), last interval (last; open squares), and average frequency (avg; pluses). Graphs for first, last, and average frequencies and current amplitudes were fitted with straight lines and the slope of these lines was used to quantify f–I relationships with current amplitude expressed relative to the threshold current (1T). Bottom panel (A3–C3): relationship between the instantaneous firing frequency and the time from the start of the pulse (f–t plot) for the cells shown in the top panel. For each cell the f–t plots at 3 different current amplitudes (expressed as multiples of the threshold current) are shown corresponding to the 3 traces in the top panel. Note the gradual lengthening of interspike intervals (ISIs) in the adapting cell in A. The cell in B increases its firing rate rapidly for the first few intervals and more gradually later in the train. Spike intervals remain virtually constant in the nonadapting cell in C.
Fig. 7.
Fig. 7.
Examples of the firing patterns in response to step current pulses for a phasic interneuron (A), a delayed onset interneuron (B), and an HM (C). Top panel (A1–C1): for each cell membrane voltage responses to 1,000-ms-long depolarizing current pulses at 3 different amplitudes are shown. Current amplitude increases from bottom to top. The smallest current pulse that resulted in repetitive firing is the threshold current (1T). Resting membrane potential is indicated in the top trace of each panel. Middle panel (A2–C2): relationship between instantaneous firing frequency and current amplitude (f–I plot) for the cells shown in the top panel. Plotted are the firing frequency for the first spike interval in the train (first; filled squares), last interval (last; open squares), and average frequency (avg; pluses). For the phasic cell only the first spike interval frequency is shown. Graphs for first, last, and average frequencies and current amplitudes were fitted with straight lines. Bottom panel (A3–C3): relationship between the instantaneous firing frequency and the time from the start of the pulse (f–t plot) for the cells shown in the top panel. For each cell the f–t plots at 3 different current amplitudes (expressed as multiples of the threshold current) are shown corresponding to the 3 traces in the top panel. Note the long delay to the first spike in the train at 1T current amplitude for the delayed onset cell and the HM cell. These 2 cell types also showed relatively little spike frequency adaptation.

Similar articles

Cited by

References

    1. Acuna-Goycolea C, Tamamaki N, Yanagawa Y, Obata K, van den Pol AN. Mechanisms of neuropeptide Y, peptide YY, and pancreatic polypeptide inhibition of identified green fluorescent protein-expressing GABA neurons in the hypothalamic neuroendocrine arcuate nucleus. J Neurosci 25: 7406–7419, 2005 - PMC - PubMed
    1. Aldes LD, Chronister RB, Marco LA. Distribution of glutamic acid decarboxylase and gamma-aminobutyric acid in the hypoglossal nucleus in the rat. J Neurosci Res 19: 343–348, 1988 - PubMed
    1. Altschuler SM, Bao X, Miselis RR. Dendritic architecture of hypoglossal motoneurons projecting to extrinsic tongue musculature in the rat. J Comp Neurol 342: 538–550, 1994 - PubMed
    1. Bevan MD, Wilson CJ. Mechanisms underlying spontaneous oscillation and rhythmic firing in rat subthalamic neurons. J Neurosci 19: 7617–7628, 1999 - PMC - PubMed
    1. Bou-Flores C, Berger AJ. Gap junctions and inhibitory synapses modulate inspiratory motoneuron synchronization. J Neurophysiol 85: 1543–1551, 2001 - PubMed

Publication types

MeSH terms

Substances

LinkOut - more resources