. 2011 Jan;85(1):481-96.
doi: 10.1128/JVI.01571-10. Epub 2010 Nov 3.

Stepwise loss of fluorescent core protein V from human adenovirus during entry into cells

Affiliations

Stepwise loss of fluorescent core protein V from human adenovirus during entry into cells

Daniel Puntener et al. J Virol. 2011 Jan.

Abstract

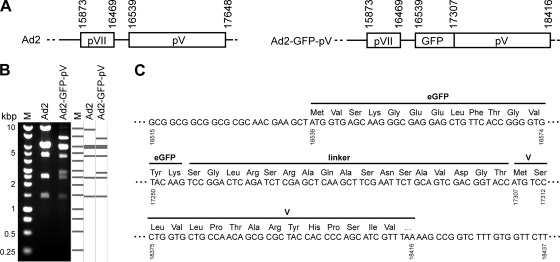
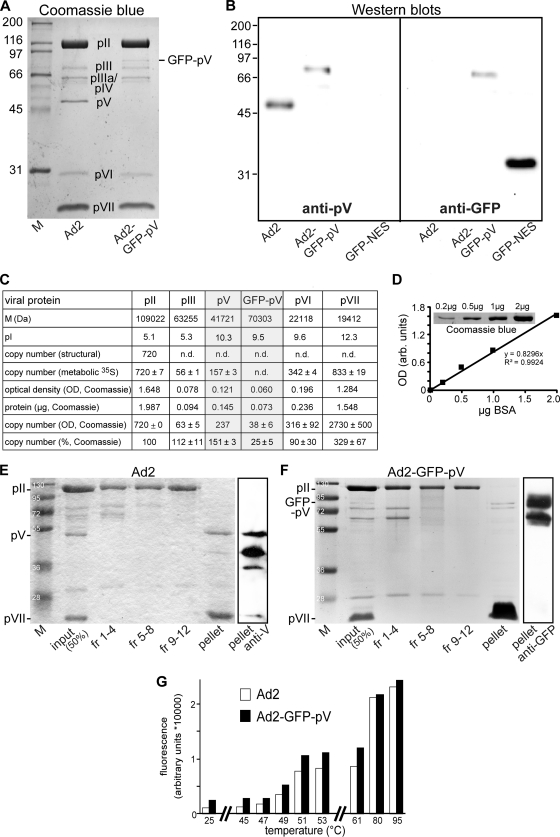
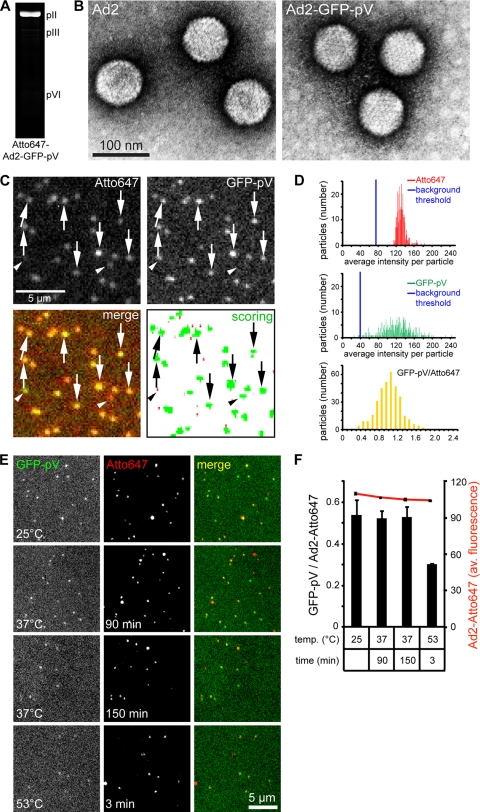
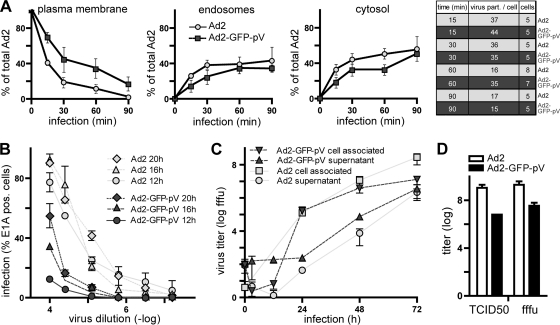
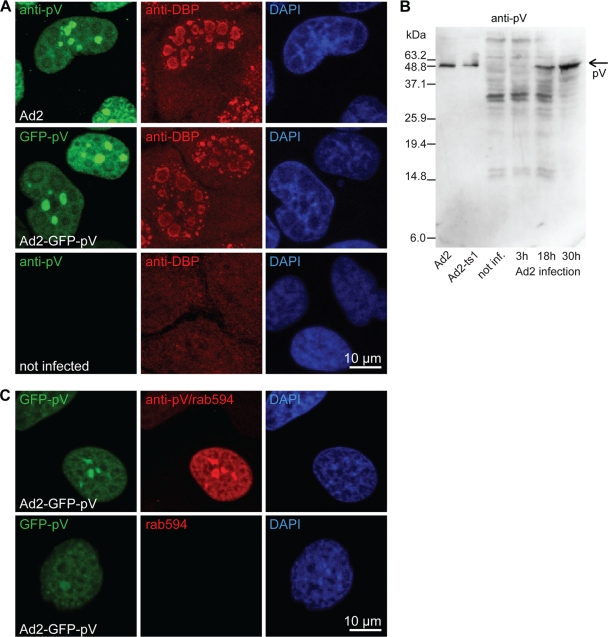
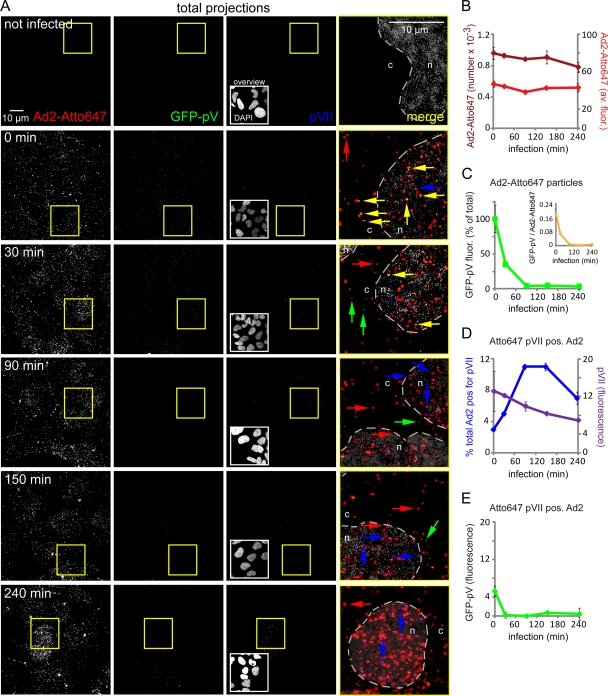
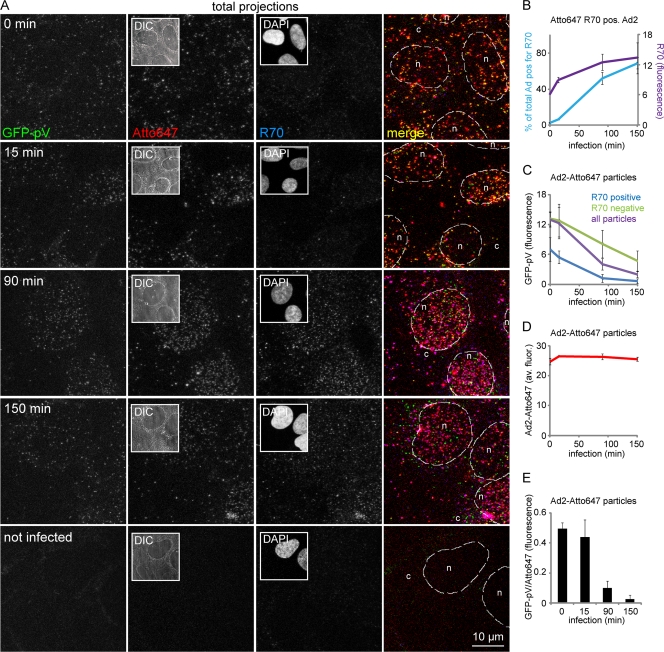
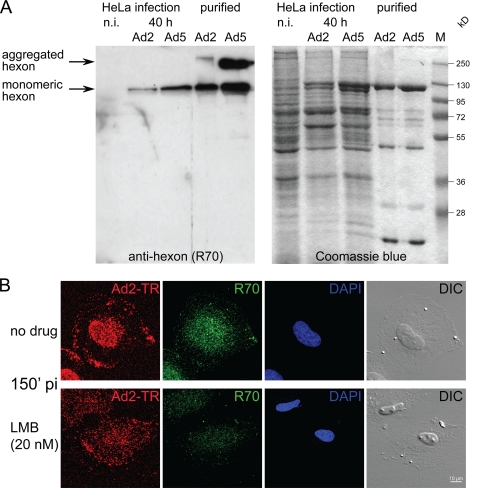
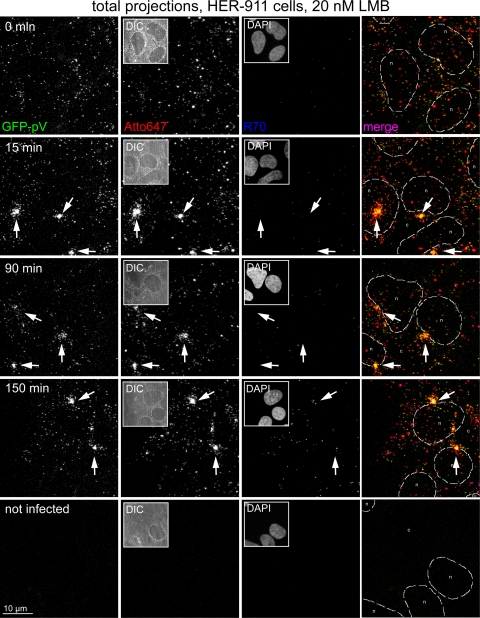
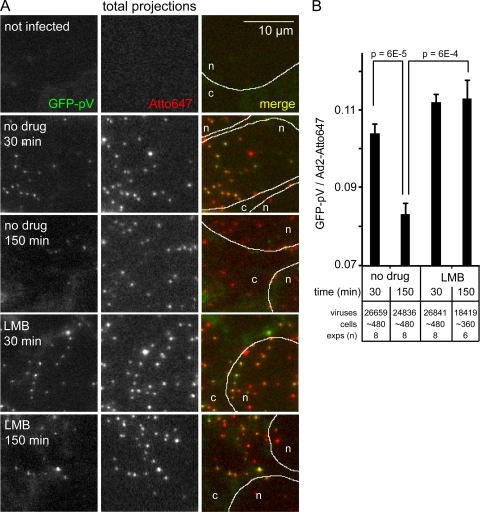
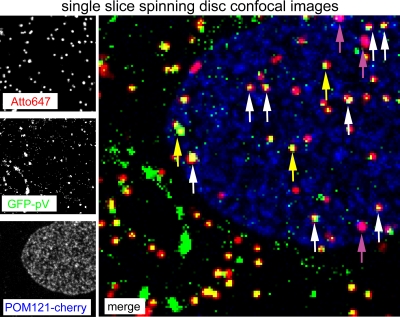
Human adenoviruses (Ads) replicate and assemble particles in the nucleus. They organize a linear double-strand DNA genome into a condensed core with about 180 nucleosomes, by the viral proteins VII (pVII), pX, and pV attaching the DNA to the capsid. Using reverse genetics, we generated a novel, nonconditionally replicating Ad reporter by inserting green fluorescent protein (GFP) at the amino terminus of pV. Purified Ad2-GFP-pV virions had an oversized complete genome and incorporated about 38 GFP-pV molecules per virion, which is about 25% of the pV levels in Ad2. GFP-pV cofractionated with the DNA core, like pV, and newly synthesized GFP-pV had a subcellular localization indistinguishable from that of pV, indicating that GFP-pV is a valid reporter for pV. Ad2-GFP-pV completed the replication cycle, although at lower yields than Ad2. Incoming GFP-pV (or pV) was not imported into the nucleus. Virions lost GFP-pV at two points during the infection process: at entry into the cytosol and at the nuclear pore complex, where capsids disassemble. Disassembled capsids, positive for the conformation-specific antihexon antibody R70, were devoid of GFP-pV. The loss of GFP-pV was reduced by the macrolide antibiotic leptomycin B (LMB), which blocks nuclear export and adenovirus attachment to the nuclear pore complex. LMB inhibited the appearance of R70 epitopes on Ad2 and Ad2-GFP-pV, indicating that the loss of GFP-pV from Ad2-GFP-pV is an authentic step in the adenovirus uncoating program. Ad2-GFP-pV is genetically complete and hence enables detailed analyses of infection and spreading dynamics in cells and model organisms or assessment of oncolytic adenoviral potential.


Figures

FIG. 1.
FIG. 1.
Construction of Ad2-GFP-pV. (A) Schematic overview of the pV and pVII loci of Ad2 (left) and Ad2-GFP-pV (right) with boxed open reading frames for pVII and pV and nucleotide numbers of the starting and terminating nucleotides. (B) XhoI restriction enzyme analysis of genomic DNA isolated from purified Ad2 and Ad2-GFP-pV with an in silico-predicted restriction pattern (right) and molecular size markers (M) in kbp. (C) DNA sequence analysis and derived amino acid sequence at the GFP-pV junction from Ad2-GFP-pV virion DNA with nucleotide numbers. Ellipses (…) indicate places where the sequence is not shown.
FIG. 2.
FIG. 2.
Biochemical characterization of Ad2-GFP-pV. (A) Twelve-percent SDS-PAGE gel stained with Coomassie brilliant blue, including protein marker (M) with relative mass in kDa. Roman numbers denote viral structural proteins. (B) Anti-pV-stained (left) or anti-GFP-stained (right) Western blotting of purified Ad2 and Ad2-GFP-pV and recombinant GFP with a nuclear export sequence (NES). pII, hexon; pIII, penton base; and pIV, fiber. (C) Estimations of copy numbers of viral structural proteins by densitometric analysis of a Coomassie blue-stained SDS-PAGE gel. The table shows calculated molecular mass values (M) for the indicated proteins, the isoelectric point (pI), the copy numbers based on the virus structure (54, 68), the copy numbers estimated by metabolic labeling (62), the measured optical density (OD), the amount of protein based on the BSA standard curve (see panel D, linear regression value, R2 = 0.9924) and the estimated copy numbers. (E and F) Sucrose density gradient-fractionated pyridine-extracted Ad2 or Ad2-GFP-pV, including a pellet (loaded as pellet plus fractions 13 and 14), molecular weight markers (M), and input sample. Gels were stained with Coomassie blue (left) or Western blotted against pV (right). Note that both intact and partially degraded pV and GFP-pV fractionate with the core protein pVII. (G) Purified Ad2 (white bars) and Ad2-GFP-pV (black bars) were heated in the presence of the DNA-intercalating dye TOTO-3, and fluorescence of the DNA-bound dye was analyzed by the Tecan Safire II microplate reader at 642- ± 8-nm excitation and 660- ± 9-nm emission. Results from one of three typical independent experiments are shown.
FIG. 3.
FIG. 3.
Ad2-GFP-pV particles contain GFP-pV. (A) Fluorogram of Atto647-labeled Ad2-GFP-pV separated by 12% SDS-PAGE and excited by 633 nm light. Positions of pII (hexon), pIII, and pVI are indicated. (B) Transmission-EM analysis of heavy metal (dark precipitates)-stained Ad2 (left) and Ad2-GFP-pV (right) shows monodispersed, intact particles. (C) Fluorescence analysis of Atto647-Ad2-GFP-pV in 96-well clear-bottom imaging plates by using an ImageXpress Micro microscope and 600- to 640-nm (Atto647 channel, top left) and 450- to 480-nm excitation (GFP channel, top right), including merged pseudocolored images (bottom left). The particles scored by the Matlab routine are shown in green, and the size threshold-rejected background puncta are in red. Arrows indicate examples of double-labeled particles, and arrowheads rare examples of single-labeled Atto647 particles. The arrowheads on the left point to a particle which contains GFP-pV but subdetection levels of Atto647. The arrowheads on the right depict a particle that did not incorporate enough GFP-pV to be detected but was labeled with Atto647. The abundance of such particles is shown in the histograms of panel D. (D) Frequency profiles of Ad2-GFP-pV fluorescence showing Atto647 (top), GFP-pV (middle), and merged ratiometric colors (bottom), including background thresholds (blue lines). (E and F) Atto647-Ad2-GFP-pV particles are stable at 37°C. Ratiometric fluorescence analysis of Atto647 and GFP-pV, including absolute values for Atto647 (red line in panel F), was conducted as described for panel C, albeit with different illumination settings. Representative images are shown for both channels (E), including the merged images and plots in panel F (number of experiments = 2).
FIG. 4.
FIG. 4.
Growth of Ad2-GFP-pV. (A) Quantitative EM analysis of Ad2 and Ad2-GFP-pV entry into HeLa-ATCC cells, scoring virus particles at the plasma membrane (left), endosomes (middle), and the cytosol (right), was performed as published (31). Note that 15 to 20% of the Ad2-GFP-pV particles are not internalized at 90 min p.i. Data points show the means ± SEM of virus particle numbers from the indicated number of cells (see table). (B) E1A expression immunofluorescence analysis of 1.5 × 10⁴ A549 cells per condition infected with serial dilutions of 1 μg of Ad2 or Ad2-GFP-pV (1 μg is approximately 3 × 10⁹ particles). Each point represents the mean ± SEM of results from three independent measurements. (C) Multiround growth curves of Ad2 and Ad2-GFP-pV in A549 cells infected with 5 fluorescent focus forming units (fffu) per cell and fffu titers of cell-associated or supernatant virus shown at the indicated time points as the means ± SEM of results from three experiments. (D) Endpoint titers of Ad2 and Ad2-GFP-pV measured as 50% tissue culture infectious dose (TCID50) units or fffu in HER-911 cells, with SEM from four independent experiments.
FIG. 5.
FIG. 5.
Anti-pV antibody detects subcellular GFP-pV from Ad2-GFP-pV that is similar to pV from Ad2. (A) HeLa-ATCC cells were infected or not infected with Ad2 or Ad2-GFP-pV at an MOI of 2 for 20 h, fixed, and stained for the viral DNA binding protein (DBP) and the nucleus (DAPI) or with an affinity-purified rabbit anti-pV antibody. Note that GFP-pV and pV are both excluded from DBP-positive areas. (B) Purified Ad2 or Ad2-ts1 and cell lysates from Ad2-infected or noninfected (not inf.) cells were fractionated by 12% SDS-PAGE, blotted, and stained with affinity purified rabbit anti-pV antibody followed by staining with goat anti-rabbit antibody conjugated to horseradish peroxidase. The specific anti-pV band is indicated with an arrow. The other bands on this blot are unrelated to pV and are due to cross-reactivity of the secondary antibody. (C) HeLa-ATCC cells were infected with Ad2-GFP-pV for 20 h and stained with anti-pV antibody and Alexa 594-conjugated goat anti-rabbit antibody (rab594) or only with secondary Alexa 594-conjugated goat anti-rabbit antibody and with DAPI. Note the extensive overlap of the GFP-pV signal with the anti-pV antibody stain.
FIG. 6.
FIG. 6.
Fluorescence microscopy reveals progressive loss of GFP-pV from incoming Ad2-GFP-pV before nuclear import of pVII. (A) Total projections of entire stacks from confocal fluorescence microscopy images of Atto647-Ad2-GFP-pV-infected HER-911 cells depict progressive loss of GFP-pV from capsids of quadruply merged channels and stippled outlines of the nuclei (n) and the cytoplasm (c). The yellow frames indicate the enlarged areas in the fourth column. Yellow arrows, Atto647/GFP-pV double-positive particles; red arrows, Atto647-positive particles; green arrows, GFP-pV particles; and blue arrows, Atto647/pVII double-positive particles. Note that the arrows at 0 min p.i. denote Atto647 plus pV (yellow) and pVII (blue) signals outside the cell. Due to the green fluorescent background of the cell, the GFP-pV signal was thresholded (see Materials and Methods), which reduced its apparent intensity. The DAPI inserts in column 3 (overviews) represent the entire fields shown in columns 1 to 3. Number of experiments, 2. (B) Quantification of the total number of scored particles (light red) and the average Atto647 fluorescence per particle (dark red). (C) Average GFP fluorescence per scored particle (green) and ratio of average GFP/Atto647 fluorescence (yellow). (D) Quantification of pVII-positive Atto647 particles (blue) and average fluorescence intensity of pVII in Atto647 particles (violet). (E) Average GFP-pV fluorescence of pVII-positive Atto647 particles.
FIG. 7.
FIG. 7.
R70 disassembly marker-positive capsids lack GFP-pV. (A) Atto647-labeled Ad2-GFP-pV particles were internalized into HER-911 cells for the indicated times, fixed, and stained with the rabbit antihexon R70 antibody and secondary anti-rabbit Alexa 594-conjugated antibody to detect preferentially disassembled capsids. The images in each row are from the same corresponding field. Downsized differential interference (DIC) and DAPI images are shown in columns 2 and 3, respectively. Scale bar, 10 μm. (B) Quantification of R70-positive capsids and overall R70 fluorescence; (C) GFP-pV in R70-positive and -negative capsids; (D) Atto647 intensity as a function of infection time; (E) GFP-pV/Atto647 fluorescence ratios at different times of infection demonstrate progressive loss of GFP-pV from the capsids.
FIG. 8.
FIG. 8.
Characterization of the antihexon R70 antibody. (A) Western blot from denaturing SDS-polyacrylamide gels containing boiled and disulfide-reduced lysates of noninfected (n.i.) cells, Ad2- or Ad5-infected cells 40 h p.i., and purified Ad2 and Ad5 particles stained with the rabbit polyclonal antibody R70 (1:200), followed by goat anti-rabbit antibody conjugated to horseradish peroxidase (HRP) and ECL detection of HRP (left), with the corresponding Coomassie blue-stained gel including molecular mass markers. (B) Periphery-localized Ad2-TR (Texas red) particles in LMB-treated cells are negative for R70 staining. HeLa cells treated with 20 nM LMB or nontreated cells were infected with Ad2-TR for 150 min, fixed, and stained for disassembled capsids with the R70 antihexon antibody (green), including DAPI signal for cell nuclei and differential interference contrast (DIC). Total projections of confocal stacks are shown for virus and R70 channels.
FIG. 9.
FIG. 9.
LMB blocks nuclear targeting of Ad2-GFP-pV and reduces R70 epitopes and loss of GFP-pV. The experiment was carried out as described in Fig. 6, except that the HER-911 cells were pretreated with 20 nM LMB 30 min prior to and during infection with Ad2-GFP-pV. Note the clustering of GFP-pV-positive particles at a distinct perinuclear site, the MTOC (white arrows), identified by anti-gamma-tubulin staining (not shown).
FIG. 10.
FIG. 10.
LMB blocks the second phase of GFP-pV loss from capsids. (A) HER-911 cells on 96-well plates were infected with Atto647-Ad2-GFP-pV and analyzed by fluorescence imaging using the automated ImageXpressMICRO fluorescence microscope for GFP-pV, Atto647 fluorescence, and the merged pseudocolored images, including the periphery of the nuclei (n) determined by DAPI staining and the cytoplasm (c) (white lines and data not shown). (B) GFP-pV quantification of the scored Atto647 particles, including total numbers of analyzed viral particles and cells and numbers of experiments (exps), with error bars representing SEM and P values from Student's t tests.
FIG. 11.
FIG. 11.
Localization of Atto647-Ad2-GFP-pV capsids near nuclear pore complexes. POM121-mCherry-transfected HER-911 cells were infected with Atto647-Ad2-GFP-pV and live imaged with spinning-disc confocal microscopy with the focus near the bottom of the nucleus at 60 min p.i. The left panel shows images recoded in the Atto647, GFP, and cherry channels. Merged images are shown in pseudocolors in the right panel, where red represents Atto647-labeled Ad2, green represents GFP-pV, and blue represents POM121-mCherry. White arrows point to triple-positive particles (red, green, blue), yellow arrows point to red and green double-positive particles, and magenta arrows point to red and blue double-positive particles.

References

    1. Alkaabi, K. M., A. Yafea, and S. S. Ashraf. 2005. Effect of pH on thermal- and chemical-induced denaturation of GFP. Appl. Biochem. Biotechnol. 126:149-156. - PubMed
    1. Baum, S. G., M. S. Horwitz, and J. J. V. Maizel. 1972. Studies of the mechanism of enhancement of human adenovirus infection in monkey cells by simian virus 40. J. Virol. 10:211-219. - PMC - PubMed
    1. Bergelson, J. M., J. A. Cunningham, G. Droguett, E. A. Kurt-Jones, A. Krithivas, J. S. Hong, M. S. Horwitz, R. L. Crowell, and R. W. Finberg. 1997. Isolation of a common receptor for coxsackie B viruses and adenoviruses 2 and 5. Science 275:1320-1323. - PubMed
    1. Berk, A. J. 2007. Adenoviridae: the viruses and their replication, p. 2355-2436. In D. M. Knipe and P. M. Howley (ed.), Fields virology, 5th ed., vol. 2. Lippincott Williams & Wilkins, Philadelphia, PA.
    1. Black, B. C., and M. S. Center. 1979. DNA-binding properties of the major core protein of adenovirus 2. Nucleic Acids Res. 6:2339-2353. - PMC - PubMed

Publication types

MeSH terms

LinkOut - more resources