

Ewing tumors that do not overexpress BMI-1 are a distinct molecular subclass with variant biology: a report from the Children's Oncology Group
- PMID: 21047978
- PMCID: PMC3711406
- DOI: 10.1158/1078-0432.CCR-10-1417
Ewing tumors that do not overexpress BMI-1 are a distinct molecular subclass with variant biology: a report from the Children's Oncology Group
Abstract
Purpose: Ewing sarcoma family tumors (ESFT) are aggressive tumors of putative stem cell origin for which prognostic biomarkers and novel treatments are needed. In several human cancers, high expression of the polycomb protein BMI-1 is associated with poor outcome. We have assessed the potential clinical significance of BMI-1 expression level in ESFT.
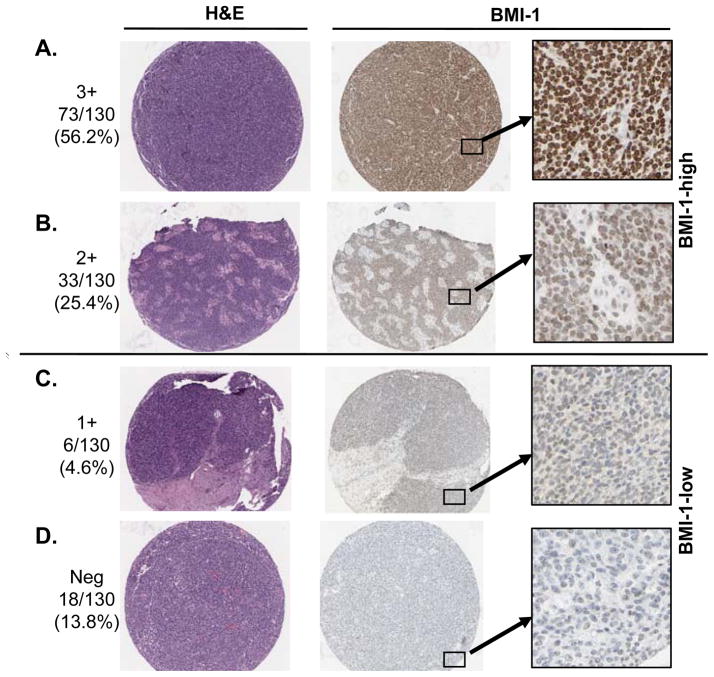
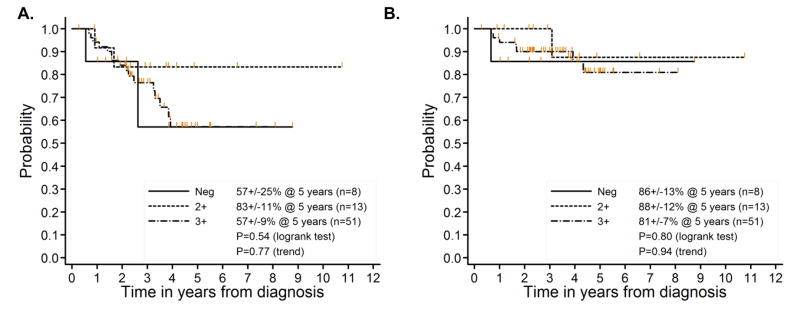
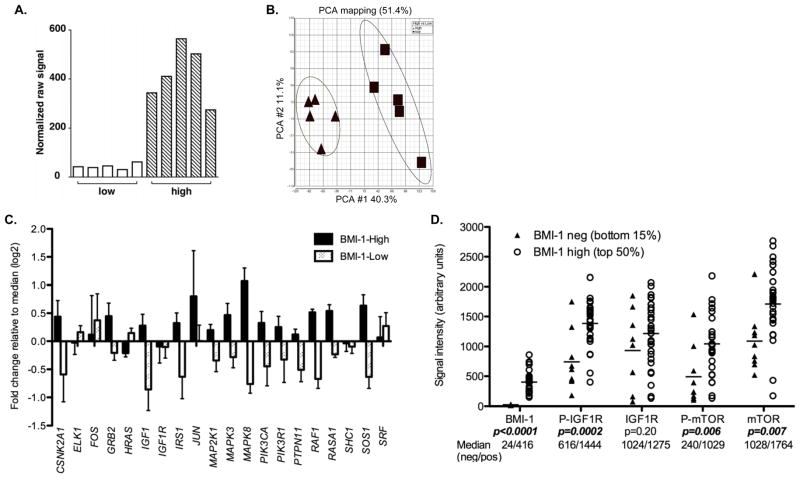
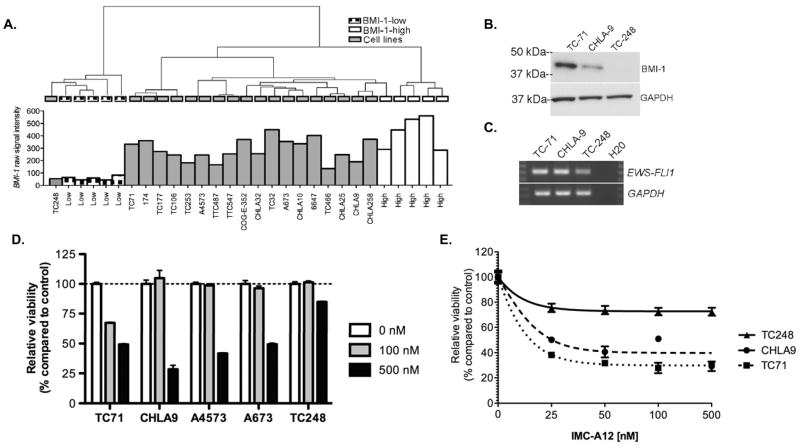
Experimental design: BMI-1 expression was assessed in 130 tumors by immunostaining and associations with clinical features and outcome determined. The molecular signatures of BMI-1-low and BMI-1-high tumors were compared using microarrays and differentially activated canonical pathways identified by gene-specific enrichment analysis. Automated quantitative analysis of phosphoproteins was used to assess relative levels of pathway activation. Sensitivity to IGF1-R inhibition was determined using MTS [3-(4,5-dimethylthiazol-2-yl)-5-(3-carboxymethoxyphenyl)-2-(4-sulfophenyl)-2H-tetrazolium] assays.
Results: BMI-1 is overexpressed by the vast majority of ESFTs. However, in 20% of cases, BMI-1 levels are low to undetectable. Significantly, although clinical presentation and outcome were similar between BMI-1-high and BMI-1-low tumors, whole genome expression array analysis showed marked differences in their respective gene expression profiles. Gene-specific enrichment analysis identified that several cancer-associated canonical biological pathways, including IGF1, mTOR, and WNT, are significantly downregulated in BMI-1-low compared with BMI-1-high tumors. Consistent with these in vivo data, the response to IGF1-R inhibition in vitro was diminished in BMI-1-low compared with BMI-1-high ESFT cells.
Conclusion: ESFT that do not overexpress BMI-1 represent a novel subclass with a distinct molecular profile and altered activation of and dependence on cancer-associated biological pathways.
©2010 AACR.
Figures
References
-
- Castillero-Trejo Y, Eliazer S, Xiang L, Richardson JA, Ilaria RL., Jr Expression of the EWS/FLI-1 oncogene in murine primary bone-derived cells Results in EWS/FLI-1-dependent, ewing sarcoma-like tumors. Cancer Res. 2005;65:8698–705. - PubMed
-
- Riggi N, Cironi L, Provero P, et al. Development of Ewing’s sarcoma from primary bone marrow-derived mesenchymal progenitor cells. Cancer Res. 2005;65:11459–68. - PubMed
-
- Tirode F, Laud-Duval K, Prieur A, Delorme B, Charbord P, Delattre O. Mesenchymal stem cell features of Ewing tumors. Cancer Cell. 2007;11:421–9. - PubMed
-
- Meltzer PS. Is Ewing’s sarcoma a stem cell tumor? Cell Stem Cell. 2007;1:13–5. - PubMed
Publication types
MeSH terms
Substances
Grants and funding
LinkOut - more resources
Full Text Sources
Molecular Biology Databases
Miscellaneous
