. 2010 Nov 3;30(44):14619-29.
doi: 10.1523/JNEUROSCI.3252-10.2010.

A specific class of interneuron mediates inhibitory plasticity in the lateral amygdala

Affiliations

A specific class of interneuron mediates inhibitory plasticity in the lateral amygdala

Jai S Polepalli et al. J Neurosci. .

Abstract

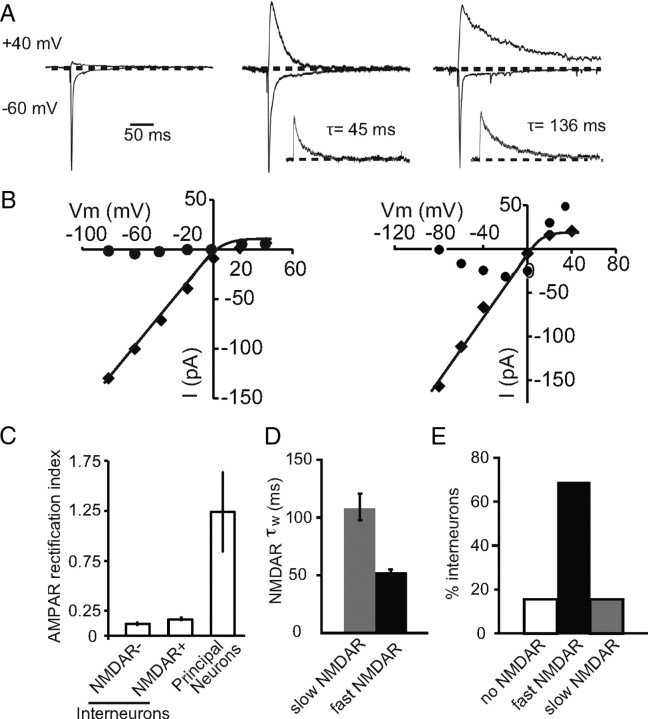
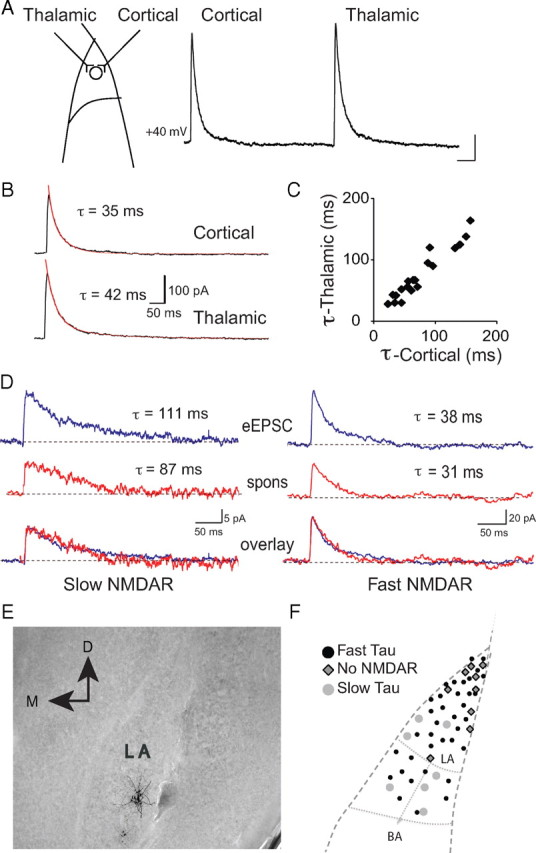
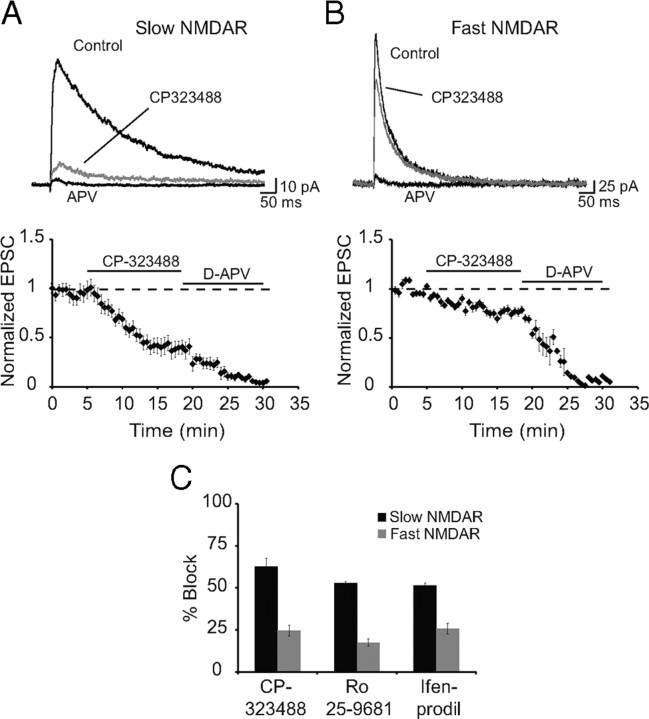
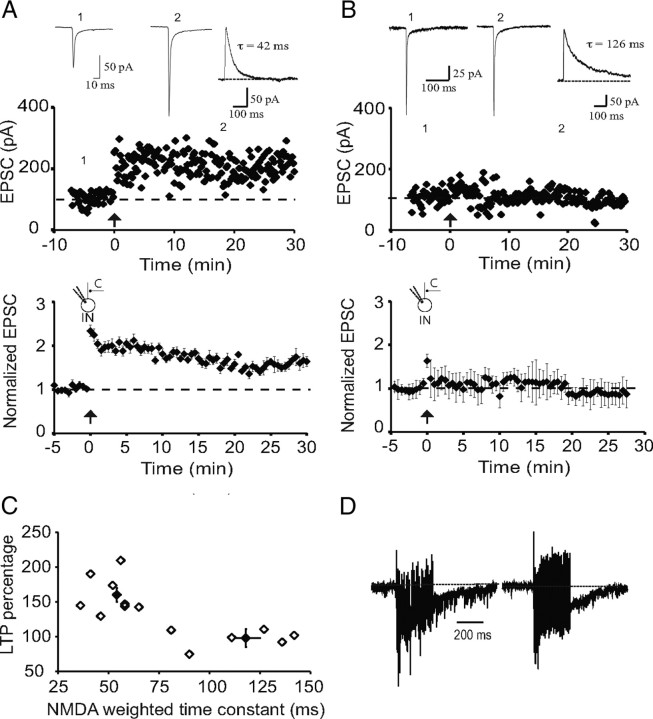
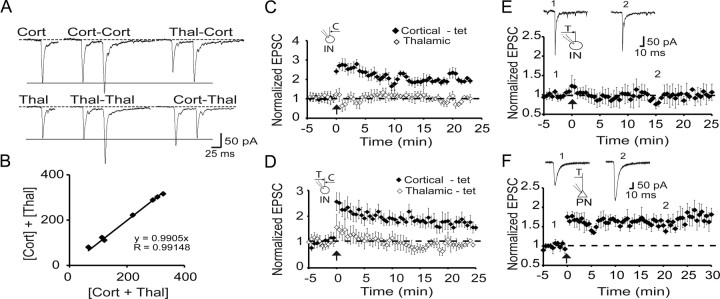
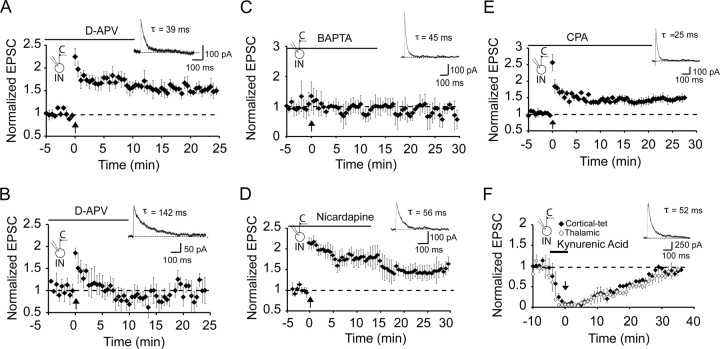
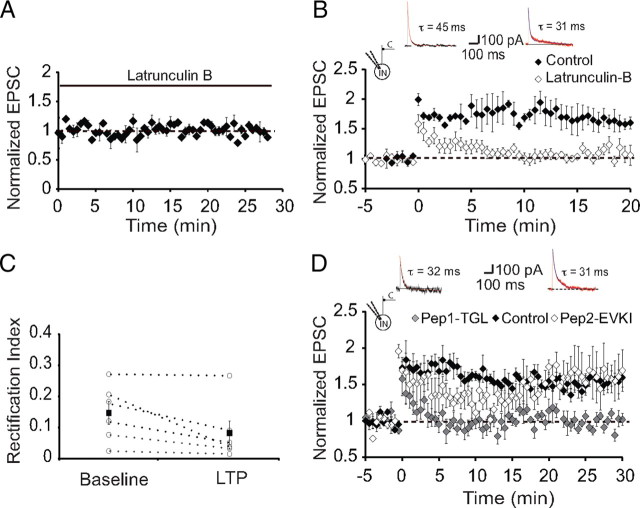
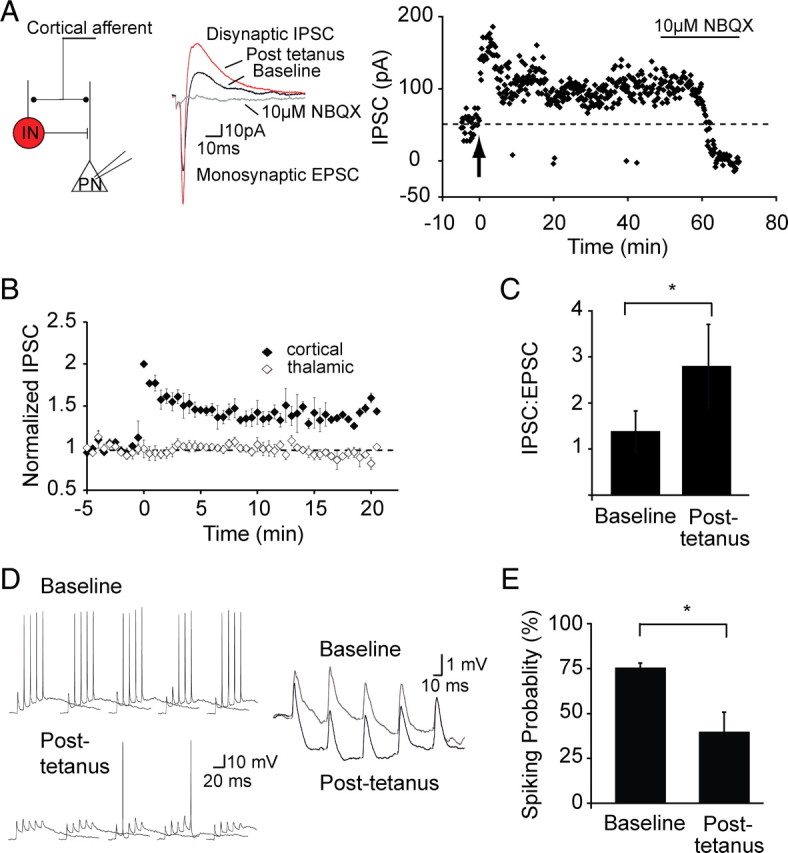
The lateral amygdala (LA) plays a key role in emotional learning and is the main site for sensory input into the amygdala. Within the LA, pyramidal neurons comprise the major cell population with plasticity of inputs to these neurons thought to underlie fear learning. Pyramidal neuron activity is tightly controlled by local interneurons, and GABAergic modulation strongly influences amygdala-dependent learning. Synaptic inputs to some interneurons in the LA can also undergo synaptic plasticity, but the identity of these cells and the mechanisms that underlie this plasticity are not known. Here we show that long-term potentiation (LTP) in LA interneurons is restricted to a specific type of interneuron that is defined by the lack of expression of synaptic NR2B subunits. We find that LTP is only present at cortical inputs to these cells and is initiated by calcium influx via calcium-permeable AMPA receptors. LTP is maintained by trafficking of GluR2-lacking AMPA receptors that require an interaction with SAP97 and the actin cytoskeleton. Our results define a novel population of interneurons in the LA that control principal neuron excitability by feed-forward inhibition of cortical origin. This selective enhanced inhibition may contribute to reducing the activity of principal neurons engaged during extinction of conditioned fear.


Figures

Figure 1.
Figure 1.
Interneurons can be differentiated based on the presence and kinetics of synaptic NMDARs. A, EPSCs evoked at holding potentials of −60 mV and +40 V normalized to the peak EPSC at −60 mV, from representative neurons with synapses that lack NMDARs (left traces), have NMDARs with fast kinetics (middle traces), or have NMDARs with slow kinetics (right traces). The inset shows the NMDAR EPSC at +40 mV with the fit time constant of decay. B, Current–voltage relationships measured at the peak of the AMPA receptor EPSC (filled squares) and 50 ms after the peak (filled circles) at a cell without (left) and with (right) synaptic NMDARs. C, Summary data of the RI of the AMPA receptor-mediated EPSC, calculated as the ratio of peak EPSC at +40 mV to the peak EPSC at −60 mV, in interneurons that have synapses with no NMDARs (NMDA−) and those with NMDARs (NMDA+). For comparison, cortical inputs to principal neurons express AMPA receptors with a rectification ratio near 1. D, Summary of NMDAR EPSC decay time constants in the LA for fast and slow NMDAR-mediated EPSC. E, Summary plot of percentages of interneurons without/with and different types of NMDARs in the LA. Sixteen percent (n = 10 of 63) of cells lacked NMDARs, 67% (n = 43 of 63) have NMDARs with fast kinetics, and 16% (n = 10 of 63) of cells have NMDARs with slow kinetics.
Figure 2.
Figure 2.
All synapses on LA interneurons have similar postsynaptic NMDARs. A, Diagrammatic representation of the innervation of a single LA interneuron by thalamic and cortical afferents. Traces on the right show EPSCs evoked at +40 mV for cortical stimulation followed by thalamic stimulation in a LA interneuron. Calibration: 100 ms, 50 pA. B, Average EPSCs fit with a weighted time constant (τw). C, Decay time constants for NMDAR-mediated EPSCs at cortical synapses plotted against decay time constants for EPSCs at thalamic synapses on interneurons (n = 19). The straight line indicates a linear fit to the data (r = 0.96) showing that decay time constants for cortical and thalamic inputs are highly correlated. D, Sample traces of evoked (eEPSC) and spontaneous (spons) NMDAR-mediated EPSCs at +40 mV in two cells with fast and slow NMDAR kinetics, respectively. In cells with slow evoked NMDAR EPSCs (top trace; τw = 111 ms). τw for spontaneous EPSCs was 87 ms (middle trace). In cells with fast evoked NMDA EPSCs (top trace; τw = 38 ms), the decay time constant of the spontaneous EPSC was 31 ms (middle trace, red). Normalized evoked and spontaneous EPSCs overlaid showing similar NMDAR kinetics (bottom trace). E, Shown is one interneuron filled with neurobiotin and recovered after electrophysiological recording. F, The distribution of all neurons in the LA with the three types of synaptic NMDAR present.
Figure 3.
Figure 3.
NMDAR EPSCs with slow kinetics are attributable to the presence of NR2B subunits. NMDARs containing NR1/NR2A and NR1/NR2B can be distinguished pharmacologically. We have used three antagonists that are more specific for NR1/NR2B receptors compared with NR1/NR2A receptors: CP323488, ifenprodil, and Ro25-9681 (Chizh et al., 2001). A, B, NMDAR EPSCs recorded at +40 mV in the presence of 10 μm NBQX and 50 μm picrotoxin from interneurons with slow (A) and fast (B) kinetics. Shown are average traces for control, CP323488 (5 μm, gray), and d-AP5 (30 μm). The time course of block of EPSCs corresponding to A and B are shown below. C, Mean data for percentage block of the slow and fast NMDA currents by CP-323488 (5 μm), Ro 25-9681 (1 μm), and ifenprodil (5 μm). CP-323488, Ro 25-9681, and ifenprodil produced 62 ± 8% (n = 9), 54 ± 1% (n = 4), and 52 ± 2% (n = 3) block in the peak EPSC for cells with slow NMDAR kinetics and 25 ± 5% (n = 4), 19 ± 3% (n = 3), and 24 ± 4% (n = 3) block of EPSCs with fast kinetics.
Figure 4.
Figure 4.
Cortical inputs to interneurons with slow synaptic NMDARs do not show LTP. A, Recording from a representative interneuron with synapses that express NMDARs with fast kinetics (τw = 42 ms). Tetanic stimulation leads to potentiation of the AMPA receptor-mediated EPSC. EPSCs recorded at the indicated time points are shown above. Inset, NMDAR-mediated EPSC recorded at +40 mV with the weighted time constant. The average response from interneurons with fast NMDAR-mediated EPSCs is shown in the graph below (n = 8). B, Recording from a representative interneuron with synapses that express NMDARs with slow kinetics (τw = 126 ms). Tetanic stimulation has no effect on EPSC amplitude. EPSCs recorded at the indicated time points are shown above. Inset, NMDAR-mediated EPSC recorded at +40 mV with the weighted time constant. The averaged response from interneurons with slow NMDAR-mediated EPSCs is shown in the graph below (n = 9). C, Scatter plot showing the amount of LTP evoked in each cell plotted against the weighted time constant of the NMDAR-mediated EPSC. D, Facilitation and charge transfer during the high-frequency stimulation are similar in both cell types containing fast and slow NMDAR kinetics. Normalized example trace (normalized to the first EPSC in the train) of HFS from interneurons containing fast NMDAR kinetics and slow NMDAR kinetics, respectively. C, Cortical input; IN, interneuron.
Figure 5.
Figure 5.
LTP is input specific and only present at cortical synapses. A, Interneurons receive independent cortical and thalamic inputs. Left, EPSCs evoked by either cortical (top traces) or thalamic (bottom traces) stimulation at a holding potential of −60 mV. Middle, Response to paired pulses for cortical or thalamic stimulation. Right, Primed pulses for thalamic followed by cortical (Thal-Cort) and cortical followed by thalamic (Cort-Thal) stimulations at an interval of 50 ms. Paired pulses for either Cort-Cort or Thal-Thal stimulations result in PPF, whereas primed pulses for either Cort-Thal or Thal-Cort do not show cross-facilitation. B, Cortical and thalamic inputs stimulated simultaneously sum together showing there are no shared fibers between the two inputs. Plotted is the algebraic sum of separately evoked EPSCs in response to cortical and thalamic stimulation ([Cort] + [Thal]) against the EPSC evoked by simultaneous stimulation of cortical and thalamic inputs ([Cort + Thal]). C, LTP of cortical inputs is homosynaptic. Average data from neurons with fast NMDAR-mediated synaptic currents in which cortical and thalamic inputs were independently stimulated (τw cortical input, 50 ± 6 ms; thalamic input, 47 ± 7 ms; n = 5). Tetanic stimulation of cortical inputs leads to potentiation with no effect on thalamic inputs. D, Cortical and thalamic inputs evoked as in C were co-tetanized at time 0. Only cortical inputs are potentiated after paired stimulation of both inputs. τw for cortical input was 43 ± 4 ms and for thalamic input was 44 ± 7 ms (n = 5). E, Thalamic inputs to interneurons do not show LTP. The left panel shows averaged data from interneurons in which thalamic inputs (τw = 54 ± 2 ms; n = 10) were tetanized at time 0. F, Average data of interleaved recordings from principal neurons in which the same thalamic input was stimulated (n = 10). EPSCs recorded at the indicated times are shown above the graph. C, Cortical input; T, thalamic input; IN, interneuron; PN, principal neuron.
Figure 6.
Figure 6.
LTP at cortical inputs requires calcium influx via AMPA/kainate receptors. A, LTP in interneurons does not require NMDAR activation. d-APV (30 μm) was applied from the start of recording in a cell that had fast NMDAR-mediated kinetics. A representative NMDAR EPSC is shown in the inset (τw = 39 ms). Tetanic stimulation leads to LTP. B, Blocking NMDARs with d-APV does not rescue LTP in interneurons with slow decaying NMDARs. d-APV (30 μm) was applied from the start of recording, and a representative NMDAR EPSC is shown in the inset (τw = 142 ms). Tetanic stimulation did not evoke LTP (n = 5). C, LTP is blocked in interneurons loaded with the calcium chelator BAPTA (10 mm; n = 5). A representative NMDAR EPSC with fast kinetics is shown in the inset. D, L-type voltage-dependent calcium channels are not required for LTP. EPSCs were recorded with 10 μm nicardipine; tetanic stimulation had no effect on LTP (n = 4). E, Store release of calcium is not required for LTP. Application of SERCA (sarco/endoplasmic reticulum Ca2+-ATPase) pump antagonist cyclopiazoic acid (CPA; 30 μm; n = 5) had no effect on LTP. F, AMPA receptor activation is required for LTP. Cortical and thalamic inputs were independently stimulated, and, after obtaining a baseline, kynurenic acid (5 mm) was applied. After EPSCs were blocked, tetanic stimulation was delivered to cortical inputs (time 0). Subsequent washout of kynurenic acid restored the EPSC to baseline equally in the both the tetanized and nontetanized pathways, showing that LTP was blocked. C, Cortical input; IN, interneuron.
Figure 7.
Figure 7.
LTP requires a functional actin cytoskeleton and SAP97. A, Lactrunculin B had no effect on basal synaptic transmission. Shown are average data of recordings from neurons with fast NMDAR-mediated synaptic currents in interneurons loaded with latrunculin B (20 μm; n = 4). B, Loading neurons with latrunculin B blocks LTP. Average data of recordings from neurons with fast NMDAR-mediated synaptic currents in interneurons loaded with latrunculin B (20 μm; n = 4; open diamonds). For comparison, interleaved recordings from neurons that were not loaded with latrunculin B (n = 4; filled diamonds). Inset, Representative NMDAR-mediated EPSCs in control and latrunculin-loaded neurons. C, AMPA receptors inserted after LTP lack GluR2 subunits. Shown is the RI of AMPA receptor EPSCs recorded before and after induction of LTP. Average RI is not significantly changed after tetanic stimulation, showing that receptors inserted after LTP also lack GluR2 subunits. D, LTP in interneurons requires interaction of GluR1 with its PDZ binding partners. Average data of recordings from neurons with fast NMDAR-mediated synaptic currents in interneurons loaded with pep1-TGL (50 μm; n = 6; open squares). For comparison, interleaved recordings from neurons that were loaded with pep2-EVKI (n = 5; gray squares) and neurons that were not loaded with any peptide (filled squares; n = 4) are shown. Inset, Representative NMDAR-mediated EPSCs in pep2-EVKI- and pep1-TGL-loaded neurons.
Figure 8.
Figure 8.
Single (A) and double (B–D) immunoperoxidase labeling of SAP97 (black) and GFP (brown) in coronal sections of LA of GAD-GFP mouse brains. A, SAP97-immunoreactive neurons are present in the LA. B, Double labeling for SAP97 and GFP revealed the majority of GFP-immunoreactive interneurons also exhibited SAP97 immunoreactivity (black arrows). Some GFP-immunoreactive interneurons indicated by red arrowheads lacked SAP97 immunoreactivity. C, Higher magnification of the dotted inset in B illustrates double-labeled interneurons. D, High-magnification image of two GFP-positive interneurons lacking SAP97 immunoreactivity. External capsule (Ec) is marked in A and B for orientation purposes. Scale bars: A, B, 50 μm; C, D, 10 μm. D, Dorsal; L, lateral.
Figure 9.
Figure 9.
Inhibitory LTP leads to reduction of activity in principal neurons. A, Schematic showing the recording configuration. Whole-cell recordings were obtained from principal neurons (PN) that were voltage clamped at −40 mV. Stimulation of cortical inputs evokes a monosynaptic EPSC followed by a disynaptic IPSC as labeled. The graph on the right plots the peak IPSC amplitude over time in response to cortical stimulation in one principal neuron. Tetanic stimulation (arrow) results in potentiation of the IPSC. Application of the AMPA receptor antagonist NBQX blocks the IPSC, confirming it is disynaptic. B, Mean data (n = 6) showing that tetanic stimulation of cortical inputs leads to an input-specific potentiation of cortical disynaptic IPSC. C, Potentiation of the IPSC shifts the balance toward greater excitation, plotted in the mean peak IPSC/EPSC ratio at baseline (1.38 ± 0.44) and after LTP (2.80 ± 0.9, *p < 0.01). D, Current-clamp recording from a principal neuron. Repetitive stimulation of cortical input (50 Hz, 5 stimuli) generates an EPSP followed by an IPSP that summates and occasionally generates action potentials. An expanded version of the response to stimulation when no action potential evoked is shown on the right. After tetanic stimulation, the resulting disynaptic IPSP is larger and, as a result, fewer spikes are evoked. E, Mean data showing the reduction in probability of spiking after tetanic stimulation. *p < 0.05.

Similar articles

Cited by

References

    1. Bauer EP, LeDoux JE. Heterosynaptic long-term potentiation of inhibitory interneurons in the lateral amygdala. J Neurosci. 2004;24:9507–9512. - PMC - PubMed
    1. Bissiere S, Humeau Y, Luthi A. Dopamine gates LTP induction in lateral amygdala by suppressing feedforward inhibition. Nat Neurosci. 2003;6:587–592. - PubMed
    1. Chizh BA, Headley PM, Tzschentke TM. NMDA receptor antagonists as analgesics: focus on the NR2B subtype. Trends Pharmacol Sci. 2001;22:636–642. - PubMed
    1. Cull-Candy S, Brickley S, Farrant M. NMDA receptor subunits: diversity, development and disease. Curr Opin Neurobiol. 2001;11:327–335. - PubMed
    1. Davis M. Diazepam and flurazepam: effects on conditioned fear as measured with the potentiated startle paradigm. Psychopharmacology (Berl) 1979;62:1–7. - PubMed

Publication types

LinkOut - more resources