Comparative Study
. 2010 Nov 3;30(44):14657-75.
doi: 10.1523/JNEUROSCI.2669-10.2010.

Supplementary motor area exerts proactive and reactive control of arm movements

Affiliations
Comparative Study

Supplementary motor area exerts proactive and reactive control of arm movements

Xiaomo Chen et al. J Neurosci. .

Abstract

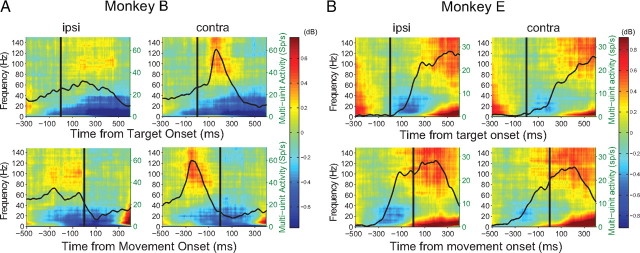
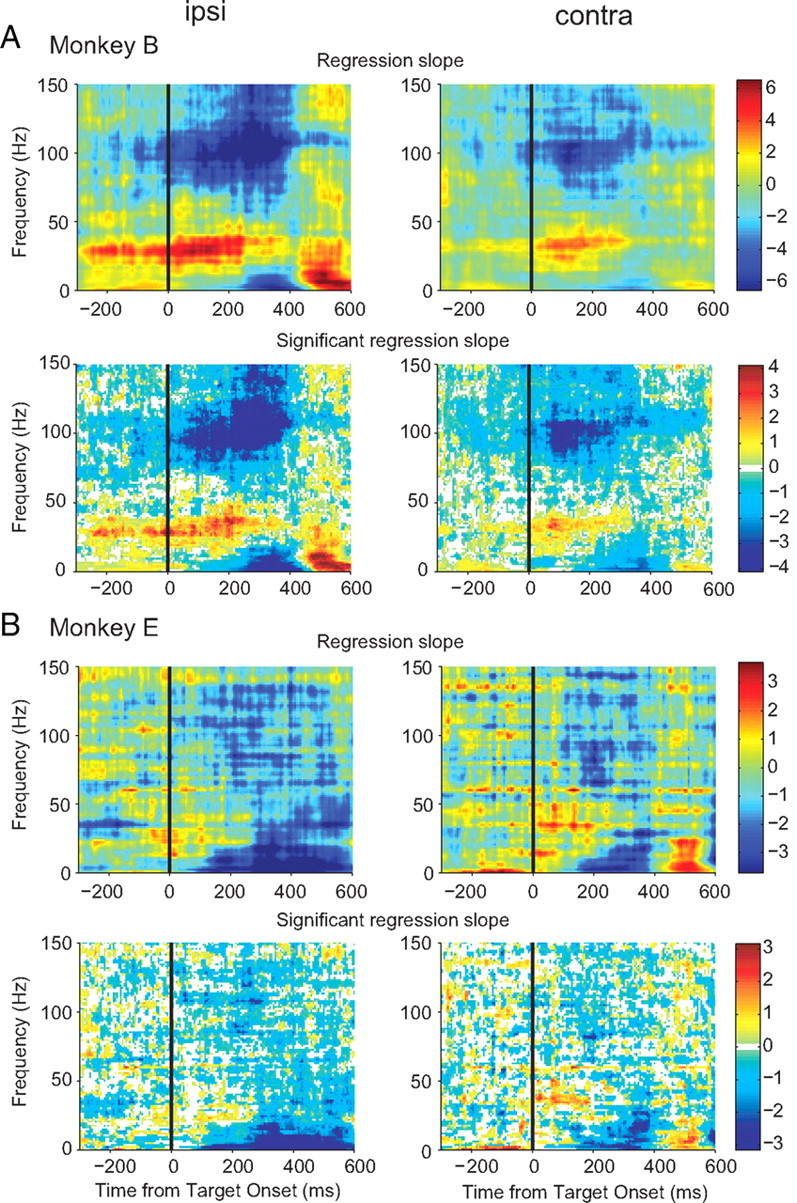
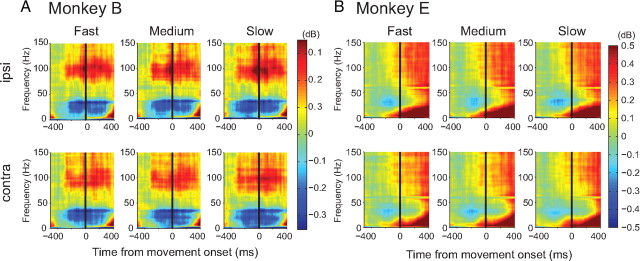
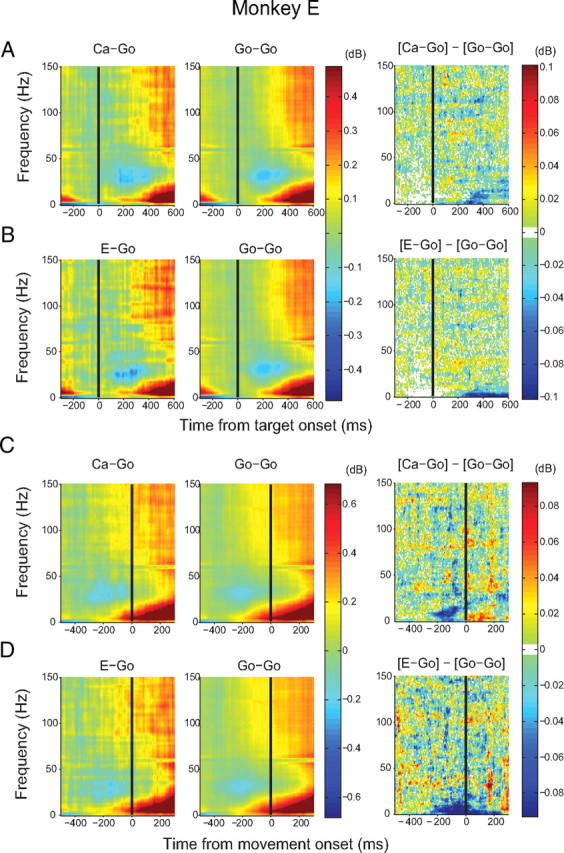
Adaptive behavior requires the ability to flexibly control actions. This can occur either proactively to anticipate task requirements, or reactively in response to sudden changes. Here we report neuronal activity in the supplementary motor area (SMA) that is correlated with both forms of behavioral control. Single-unit and multiunit activity and intracranial local field potentials (LFPs) were recorded in macaque monkeys during a stop-signal task, which elicits both proactive and reactive behavioral control. The LFP power in high- (60-150 Hz) and low- (25-40 Hz) frequency bands was significantly correlated with arm movement reaction time, starting before target onset. Multiunit and single-unit activity also showed a significant regression with reaction time. In addition, LFPs and multiunit and single-unit activity changed their activity level depending on the trial history, mirroring adjustments on the behavioral level. Together, these findings indicate that neuronal activity in the SMA exerts proactive control of arm movements by adjusting the level of motor readiness. On trials when the monkeys successfully canceled arm movements in response to an unforeseen stop signal, the LFP power, particularly in a low (10-50 Hz) frequency range, increased early enough to be causally related to the inhibition of the arm movement on those trials. This indicated that neuronal activity in the SMA is also involved in response inhibition in reaction to sudden task changes. Our findings indicate, therefore, that SMA plays a role in the proactive control of motor readiness and the reactive inhibition of unwanted movements.


Figures

Figure 1.
Figure 1.
The arm stop-signal task. Each trial begins when the cursor is positioned inside the center box. After a delay, the target box appears to one side of the screen and the center box disappears, instructing the monkey to move the cursor into the target box. On stop-signal trials, the center box reappears after the stop-signal delay (SSD), signaling that the monkey should cancel the planned movement. On the variable reward version of the paradigm, the color of the center box indicates whether the trial will result in a high or low reward if performed correctly.
Figure 2.
Figure 2.
Localization of recording sites. A, A model of the brain for monkey B constructed from MRI slices showing the pre-SMA region highlighted in blue and the SMA region highlighted in green (left). Major sulci are outlined in yellow. The black box indicates the location of the recording chamber and the yellow grid indicates the recording sites. A magnified version of the recording grid is shown to the right. The circles indicate the location of electrode penetrations. The red circle sizes indicate the number of movement-related neurons found at that location (large: 9–12 cells, medium: 5–8 cells, small: 1–4 cells). Penetrations that yielded no movement-related neurons are indicated by black dots. The horizontal black line indicates the location of the branch of the arcuate sulcus. B, Chamber location and recording sites from monkey E.
Figure 3.
Figure 3.
Effects of trial history on response time. A, The mean response times on no-stop-signal trials, noncanceled trials, corrected trials, no-stop-signal trials that followed other no-stop-signal trials, and no-stop-signal trials that followed stop trials are shown for monkey B (top) and monkey E (bottom). Error bar represents the half SD. B, Response times for no-stop-signal and stop trials surrounding noncanceled trials (left), trials surrounding canceled trials (middle), and trials surrounding corrected trials (right) for monkey B (top) and monkey E (bottom). The type of trials to which the response time corresponds to is shown in bold (G: no stop signal; E: noncanceled; Ca: canceled; Co: corrected). The dotted line indicates the average response time on no-stop-signal trials.
Figure 4.
Figure 4.
Examples of local field potentials and multiunit activity recordings. Time–frequency map of changes in the LFP power relative to baseline (in decibels), together with the firing rate of the simultaneously recorded multiunit activity (overlaid black curve). A, Recording from the SMA of monkey B. B, Recording from the SMA of monkey E.
Figure 5.
Figure 5.
Grand average of local field potentials and multiunit activity. The resulting time–frequency maps of the normalized change in LFP power and multiunit activity (overlaid black curve) across all the recordings for ipsilateral movements (left column) and contralateral movements (right column) are shown aligned on both target presentation (up) and movement initiation (bottom). A, Grand average of all recordings from SMA of monkey B. B, Grand average of all recordings from SMA of monkey E.
Figure 6.
Figure 6.
Grand average of local field potential aligned on target presentation with fast, medium, and slow responses. The upper row shows ipsilateral movements, and the lower row shows contralateral movements across all recordings. A, Grand average of all recordings from SMA of monkey B. B, Grand average of all recordings from SMA of monkey E.
Figure 7.
Figure 7.
Time–frequency map of the mean regression slope between reaction time and LFP power recorded in SMA aligned on target onset. The upper panels plot the mean slope of the linear regression between the LFP power and arm movement reaction time across all recordings from SMA of monkey B. The lower panels show the mean slope of only the significant regressions. The left panels plot ipsilateral movements, while the right panels plot contralateral movements. A, Monkey B. B, Monkey E.
Figure 8.
Figure 8.
Grand average of local field potentials of monkey B aligned on movement initiation with fast, medium, and slow responses across all SMA recordings. Conventions are as in Figure 6. A, Monkey B. B, Monkey E.
Figure 9.
Figure 9.
Time–frequency map of the mean regression slope between reaction time and LFP power recorded in SMA aligned on movement onset. Conventions are as in Figure 7. A, Monkey B. B, Monkey E.
Figure 10.
Figure 10.
Relationship of multiunit activity to reaction time. The activity of a representative SMA multiunit activity is illustrated aligned on target onset (A) and on arm movement initiation (B) for its preferred direction. All trials with no stop signals were divided into five groups with equal number of trials according to arm movement response time from fastest (yellow) to slowest (red). C, The result of the regressions between the timing of the reaction time and the timing of the activity onset, the timing of the peak activity, and slope when aligned on target onset. D, The same regression results when aligned on arm movement initiation.
Figure 11.
Figure 11.
Distribution of regression coefficients describing the relationship of multiunit activity to reaction time across all recording sites. The distribution of regression coefficients between the timing of the reaction time and the timing of the activity onset (top), the timing of the peak activity (middle), and slope (bottom) when aligned on target presentation (left) and on arm movement initiation (right) is shown. Recordings with significant regression values are shown in black.
Figure 12.
Figure 12.
Effects of trial history on LFP power in the SMA of monkey B. Comparison was performed between three groups of no-stop-signal trials: those that followed another canceled trial (Ca-Go), those that followed a not-canceled error trial (E-Go), and those that followed a go trial (Go-Go). In the upper two rows (A, B), the time–frequency maps were aligned on target onset. A, Comparison between Ca-Go and Go-Go trials. The left panel shows grand average of time–frequency map of LFP power during Ca-Go, and the middle panel shows that during Go-Go trials. The significant differences between them are shown in the right panel. B, Comparison between E-Go and Go-Go trials. In the lower two rows (C, D), the time–frequency maps were aligned on movement onset. C, Comparison between Ca-Go and Go-Go trials. D, Comparison between E-Go and Go-Go trials.
Figure 13.
Figure 13.
Effects of trial history on LFP power in the SMA of monkey E. Conventions are as in Figure 12.
Figure 14.
Figure 14.
Effects of trial history on multiunit activity for two SMA recording sites. The panels in A and B show representative multiunit recordings from two different locations in the SMA of monkey B. The upper panels show the multiunit activity on Ca-Go trials (red) and on Go-Go trials (black) aligned on target (left) and movement (right) onset. The lower panels show the comparison between E-Go (red) and (black) Go-Go trials. Discharge rate was measured in three intervals indicated by the red and black lines and was tested for significant differences using a bootstrapping test.
Figure 15.
Figure 15.
Single-unit neural activity modified by response time. The activity of two SMA neurons during movements toward their preferred direction in five reaction time groups was aligned on target presentation (upper row) and on arm movement initiation (lower row). Conventions are as in Figure 10. A, SMA neuron from monkey B. B, SMA neuron from monkey E.
Figure 16.
Figure 16.
Changes in LFP power predict arm movement cancelation. A representative recording in the SMA of monkey B is shown for ipsilateral (A) and contralateral (B) movements in the stop-signal task. The time–frequency maps represent the LFP activity aligned on target onset (first vertical line) for two different SSDs (second vertical line). The SSRT is indicated by the third vertical line. The panels in the upper row show the activity in latency-matched no-stop-signal trials, the middle panels show the activity during the canceled trials, and the lower panels show the significant difference between canceled and latency-matched no-stop-signal trials. The black line overlaying the time–frequency maps in the upper and middle panels indicates the simultaneously recorded multiunit activity. The gray background in the lower panels indicates the time period during which the LFP power was compared.
Figure 17.
Figure 17.
Grand average of comparison of LFP power between canceled and no-stop-signal trials. The grand average of the difference in LFP power was formed by taking the average of all the time–frequency maps aligned on the SSRT for each recording in the SMA of monkey B (A) and of monkey E (B). The panels on the left show the activity in latency-matched no-stop-signal trials (“Go”), the middle panels show the activity during canceled trials (“Can”), and the right panels show the significant difference between canceled and latency-matched no-stop-signal trials (“Can-Go”). The panels in the upper row show ipsilateral movements, while the panels in the lower row show contralateral movements. For more details, see Results.

Similar articles

Cited by

References

    1. Aron AR, Poldrack RA. Cortical and subcortical contributions to stop signal response inhibition: role of the subthalamic nucleus. J Neurosci. 2006;26:2424–2433. - PMC - PubMed
    1. Aron AR, Behrens TE, Smith S, Frank MJ, Poldrack RA. Triangulating a cognitive control network using diffusion-weighted magnetic resonance imaging (MRI) and functional MRI. J Neurosci. 2007a;27:3743–3752. - PMC - PubMed
    1. Aron AR, Durston S, Eagle DM, Logan GD, Stinear CM, Stuphorn V. Converging evidence for a fronto-basal-ganglia network for inhibitory control of action and cognition. J Neurosci. 2007b;27:11860–11864. - PMC - PubMed
    1. Basso MA, Wurtz RH. Modulation of neuronal activity in superior colliculus by changes in target probability. J Neurosci. 1998;18:7519–7534. - PMC - PubMed
    1. Benjamini Y, Yekutieli Y. The control of the false discovery rate under dependency. Ann Stat. 2001;29:1165–1188.

Publication types

LinkOut - more resources